MicroOffice - 🚧 Word, Excel and Visio - Сообщения
XP Home scraped all my Excel Win Me.
Who cares Excel, not a CAS vs Smath.
All my tools are perpetual, some more ancient than 2000.
1. CutePDF
2. Adobe 100%
Perfect for publishing, so quick !
Moody.pdf (70,73 КиБ) скачан 888 раз(а).
Who cares Excel, not a CAS vs Smath.
All my tools are perpetual, some more ancient than 2000.
1. CutePDF
2. Adobe 100%
Perfect for publishing, so quick !
Moody.pdf (70,73 КиБ) скачан 888 раз(а).
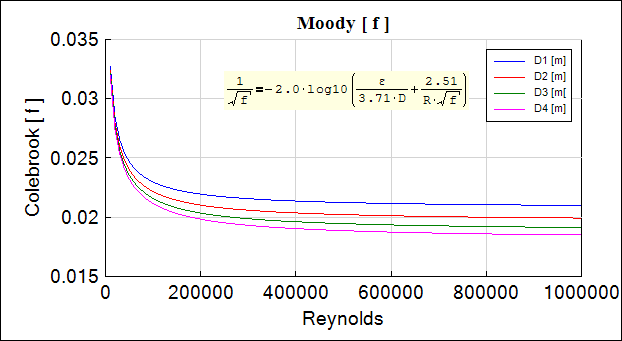
WroteNote the difference of as-printed quality
between X-Y Plot output and excel_EMF output.
X_Y plot has plenty of options: quality or preference.
overlord:
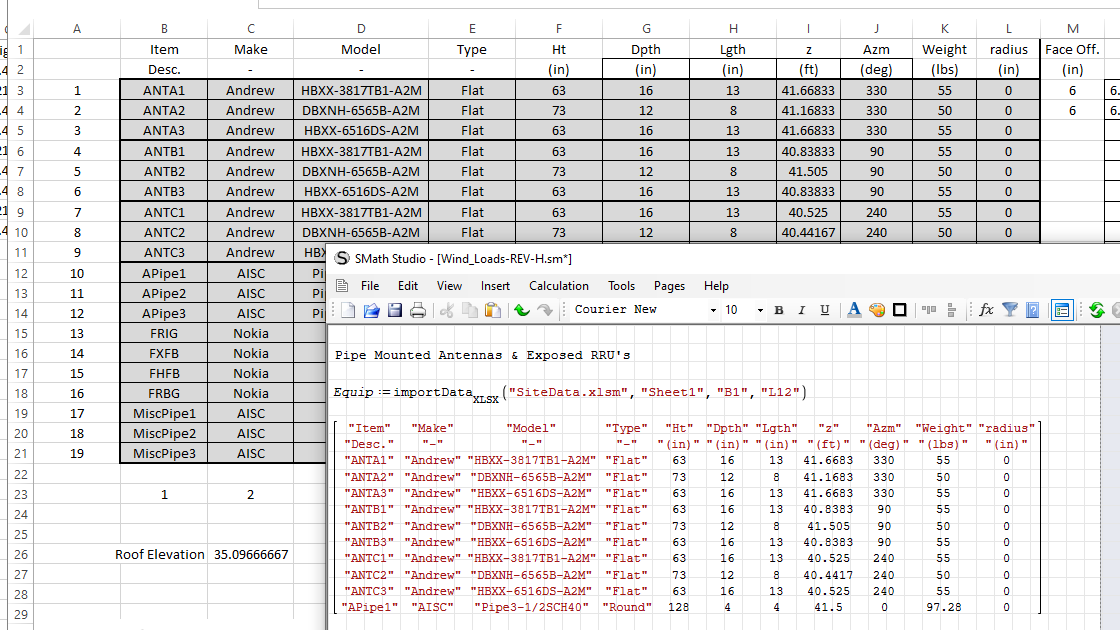
are you trying to bring in a chart or data table into SMath? your original post referred to table data.
can you use Alex's EXCEL I/O plug in to read in the table directly?
i use it to grab arrays out of excel. with a bit of clever formatting, you can bring in units as well if they are syntaxed correctly.
i find it MUCH easier to edit and manipulate arrays in Excel than in SMath.
here is a snip with SMath and the excel sheet it imports from below.
Join the SMath Studio Users Discord Channel: https://discord.gg/PayZpJW

WroteNote the difference of as-printed quality between X-Y Plot output and excel_EMF output.
X-Y Plot has no pixelation now (this was fixed a year ago.).
Russia ☭ forever, Viacheslav N. Mezentsev
WroteX-Y Plot has no pixelation now (this was fixed a year ago.).
Easy otherwise pixelation [when convenient].
Caliper the plot width to length of data set.
That one does not fit my small screen.
Copy image, paste in IrfanView to recover quality.
WroteWroteNote the difference of as-printed quality between X-Y Plot output and excel_EMF output.
X-Y Plot has no pixelation now (this was fixed a year ago.).
Hi Uni, did not mean to stir trouble - the original post is over a year ago - i have just used it for an easy examle of displaying excel with no quality loss
Wrotedid not mean to stir trouble
I didn't either...
Pure tip to plot points as symbol, superposed/overposed
over other range of data on same X_Y trace.
Example: Isometric just posted [too small screen to caliper].
Wrotei have just used it for an easy examle of displaying excel with no quality loss
You mean: compare X_Y vs Excel ... X_Y of equal fineness ?
Post the maths that plot X_Y ... looks interesting.
Maybe convincing.
- Новые сообщения
- Нет новых сообщений