Image Region - ⛔ Extends SMath Studio with an Image Region. - Сообщения

WroteStill there is another, more important issue: could you please interpret relative paths with respect to the directory of the current SMath document instead of the current directory? This would create portable documents and enable putting examples in the activebook help system.
I can't do that. More precisely, I don't know how to do it, because SMath Studio does not provide such information. That's why I added CurrentDirectory() function. There is another way to change the current folder. Open the document and then save it via the Save As option. In this case, SMath Studio will change the current path. The path must be changed when the file is opened, but it doesn't. You have to ask Andrey to implement this feature.
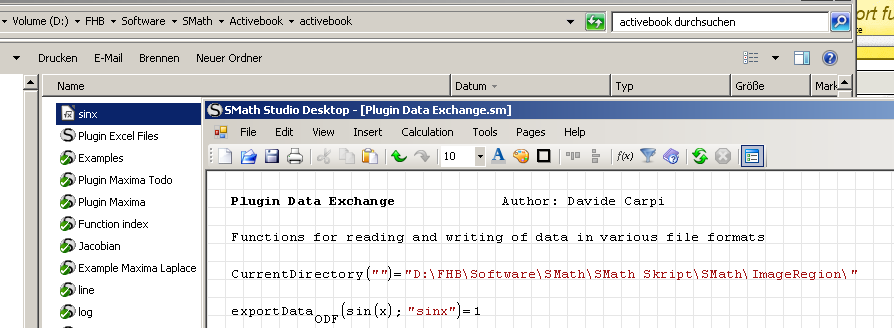
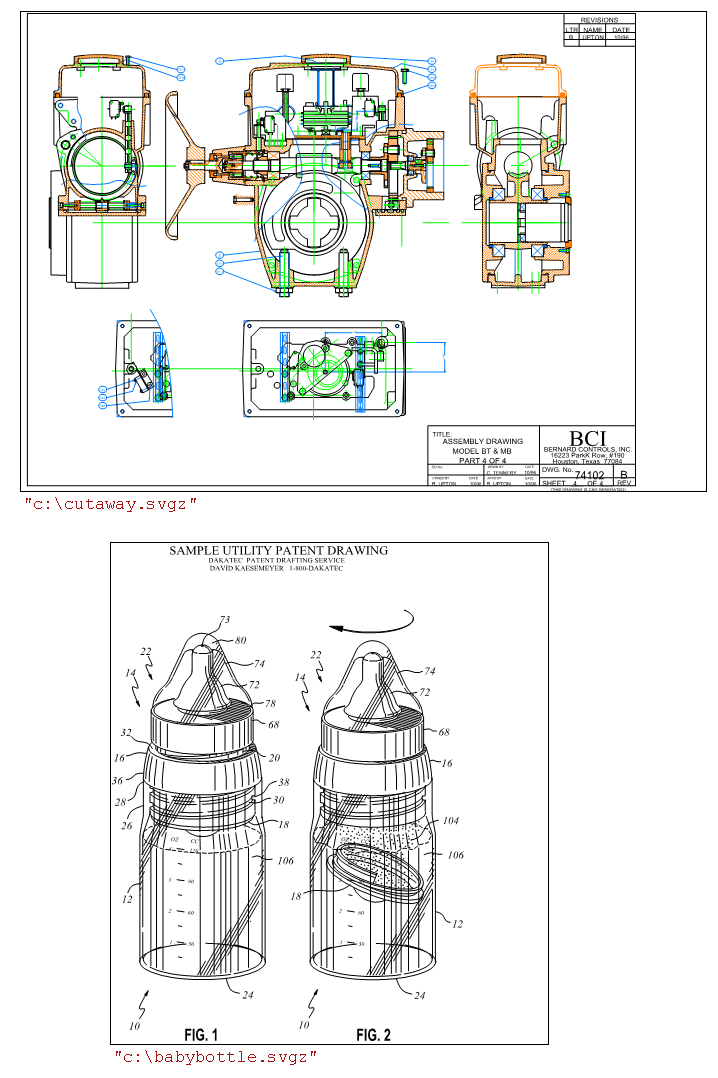
In the attached screen shot you see a document, where a formula is exported using a relative path. The file is created in the directory of the currently open SMath document, even if that is not the current system directory (as can be seen in the CurrentDirectory() output).
May be the approach is not available for custom regions. Then a separate function like "DocumentDirectory()" would help, just as the function "SettingsDirectory()" from CustomFunctions, which is used to build the hyperlink targets in the activebook plugin index.
Wrote... but it is available only at the time of its evaluation.
Great, thanks. Seems to work. However, I do not understand what limitation is implied by your statement.
I'd also propose to provide sort of image scaling and clipping, with mouse interaction consistent to the xy plot region, i.e.
- zoom by mouse wheel
- move by dragging the image
- resize by dragging the boundary resizing markers
- double click to reset to default (according to feature request above)
This might be sensible only for display of images from files.
WroteWrote... but it is available only at the time of its evaluation.
Great, thanks. Seems to work. However, I do not understand what limitation is implied by your statement.
This was remark for developers.
WroteWould it be possible to size the region according to the image size? Perhaps as an option.
I'd also propose to provide sort of image scaling and clipping, with mouse interaction consistent to the xy plot region, i.e.
- zoom by mouse wheel
- move by dragging the image
- resize by dragging the boundary resizing markers
- double click to reset to default (according to feature request above)
This might be sensible only for display of images from files.
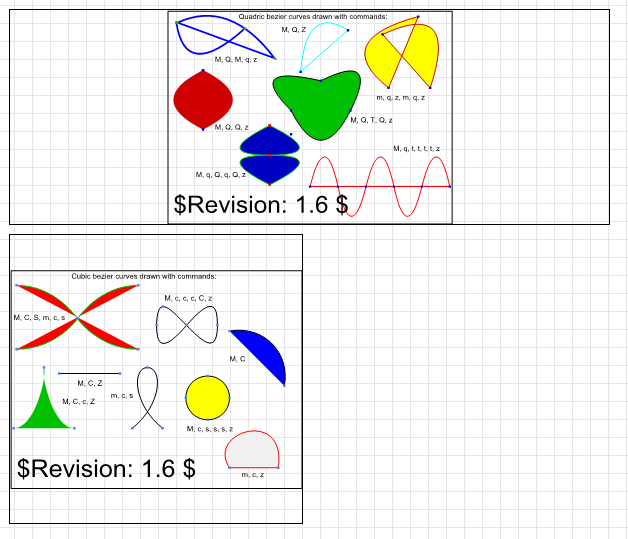
Ok, I'll think about it too. As for svg images, you can change the size of this type of images, but only if the dimensions are not specified in the file. Try these svg-files.
svg.zip (5,06 КиБ) скачан 377 раз(а).

325 сообщений из 2 052 понравились и 1 не понравились пользователям.
Группа: Moderator
I suppose there is not a way to respect their aspect ratio by dragging the resizing either of the dragging markers (just asking). Actually, we can make it fit - if we want - by dragging the individual markers separately.
Regards,
Radovan
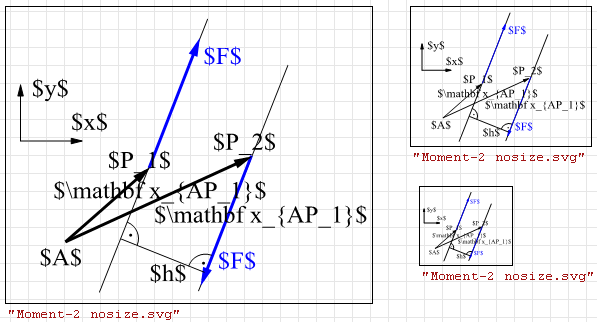
WroteAs for svg images, you can change the size of this type of images, but only if the dimensions are not specified in the file.
Thanks, this works. In my example, I just had to removing this: width="65.29mm" height="52.71mm"

WroteUpdated. Added support for svg.
Great feature, thank you Viacheslav


I tried the method suggested by Martin, It works fine with Jpgfdraw files (save as SVG) but not with Inkscape file (save as SVG or Pure SVG)
sergio
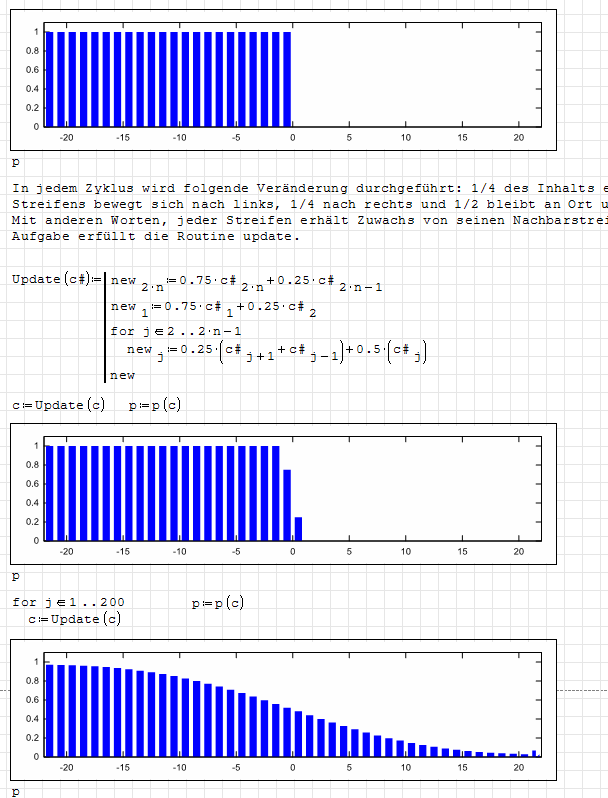
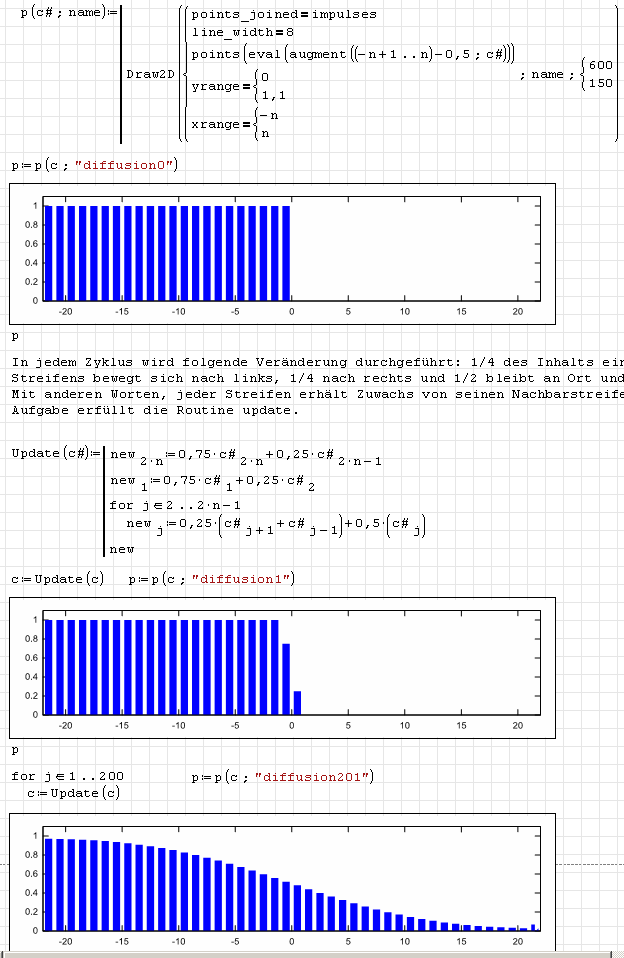
Then we would have a neat way to display Maxima generated images using the Draw2D() and Draw3D() functions as described here.
These functions return the file name of the generated image.
gnuplot_input.zip (1,14 КиБ) скачан 363 раз(а).
325 сообщений из 2 052 понравились и 1 не понравились пользователям.
Группа: Moderator
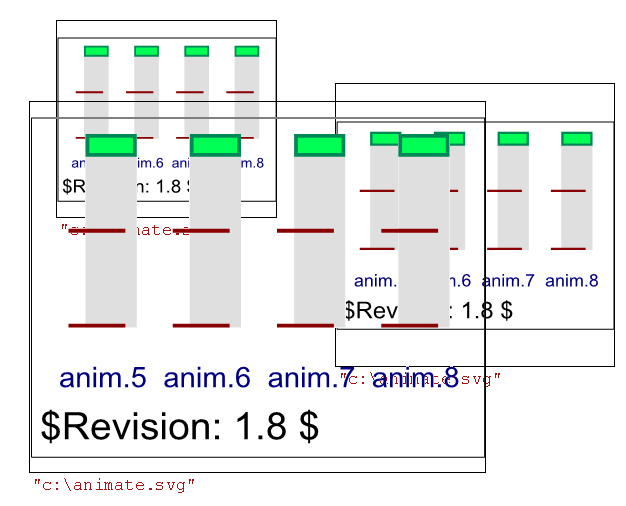
Hmm...I might missed something, but I can not see the plots in the SMath "Diffusion.sm" file. I expected to see them (as usual) but the regions are empty and the *.svg files are not in the active directory (dir variable). See the picture and the log file please.
Regards,
Radovan
EDIT: Strange
 , I managed somehow to get those bargraphs - right bars were decreseing ( by moveing dir:= ). On the third one I saw th problem at the end - but can not reproduce anymore. Still empty regions???
EDIT2: It seems that Maxima restart and few recalculations will bring the plots (second picture)
h0.01 - if you remove this then you'll get the right result.
<g style="fill:none; color:red; stroke:currentColor; stroke-width:8.00; stroke-linecap:butt; stroke-linejoin:miter">
	<path stroke='rgb(  0,   0, 255)'  d='M41.9,126.0 L41.9,24.5 M54.4,126.0 L54.4,24.7 M66.8,126.0 L66.8,25.0 M79.3,126.0 L79.3,25.5
		M91.7,126.0 L91.7,26.2 M104.2,126.0 L104.2,27.1 M116.6,126.0 L116.6,28.1 M129.1,126.0 L129.1,29.4
		M141.5,126.0 L141.5,31.0 M154.0,126.0 L154.0,32.7 M166.4,126.0 L166.4,34.7 M178.8,126.0 L178.8,37.0
		M191.3,126.0 L191.3,39.5 M203.7,126.0 L203.7,42.3 M216.2,126.0 L216.2,45.3 M228.6,126.0 L228.6,48.5
		M241.1,126.0 L241.1,52.0 M253.5,126.0 L253.5,55.7 M266.0,126.0 L266.0,59.5 M278.4,126.0 L278.4,63.5
		M290.9,126.0 L290.9,67.6 M303.3,126.0 L303.3,71.7 M315.8,126.0 L315.8,75.8 M328.2,126.0 L328.2,80.0
		M340.7,126.0 L340.7,84.1 M353.1,126.0 L353.1,88.0 M365.6,126.0 L365.6,91.9 M378.0,126.0 L378.0,95.5
		M390.5,126.0 L390.5,99.0 M402.9,126.0 L402.9,102.3 M415.4,126.0 L415.4,105.3 M427.8,126.0 L427.8,108.0
		M440.3,126.0 L440.3,110.6 M452.7,126.0 L452.7,112.8 M465.1,126.0 L465.1,114.8 M477.6,126.0 L477.6,116.6
		M490.0,126.0 L490.0,118.1 M502.5,126.0 L502.5,119.4 M514.9,126.0 L514.9,120.5 M527.4,126.0 L527.4,121.4
		M539.8,126.0 L539.8,122.0 M552.3,126.0 L552.3,122.6 M564.7,126.0 L564.7,122.9 M577.2,126.0 L577.2,123.0
		 '/></g>
P.S. Now the background is not removed.
1. this all applies to SMath 0.96.4909, as the image region is (was) not yet available for the new build (updated Maxima is available on SVN, but still in testing)
2. There might be a timing/robustness issue, it is a bit risky to use identical file names for different plots in the sheet. I changed the sheet such that you get different file names. The images should be produced upon opening or recalculating the sheet.
@uni: Thanks for the update. I confirm that removing h0.01 from wherever in the svg file mitigates the problem (in the old and in the new ImageRegion version). What does h0.01 say? Perhaps that can be avoided by particular plot settings? Just like with the scaling, where it proved possible to get scalable svgs without regexping the svg file.
Another question: Is that a gnuplot bug which I should report there or is this a problem of the image region (and of the IE)?
ЦитатаWhat does h0.01 say?
8.3.4 The "lineto" commands
Perhaps this is a bug in the SharpVectors library that I use.
WrotePerhaps this is a bug in the SharpVectors library that I use.
I do not know why gnuplot draws a very short horizontal line at the top of the last blue vertical bar. This might be a bug but should essentially be invisible with butt line ends.
The IE rendering and the image region show this horizontal line much too long.
On top of this, the image region somehow wrongly joines the horizontal and the vertical line.
WroteAnother question: Is that a gnuplot bug which I should report there or is this a problem of the image region (and of the IE)?
I've noticed the same issues both in chrome and firefox... so, is a bug in the image or in all the major browers :-p
EDIT: and here is the response, saying that the horizontal line was a fix for viewer problems in the past but should not be visible. There is no fast way to fix the problem.
There are some posts in the group, saying that most viewers render svg wrongly, but that would be no reason to modify the svg export, as it is the fault of the viewers.
Alternativly, Maxima/Gnuplot could export eps or pdf. Uni, if you can display that in a scalable way, then I could possibly switch to that terminal. I attached two corresponding files (had to zip the eps, because such attachments are not allowed in the forum)
myfile.zip (4,55 КиБ) скачан 348 раз(а).
- Новые сообщения
- Нет новых сообщений