Page History: Graphs
Compare Page Revisions
Page Revision: 2012/04/27 18:17
How to add an empty graph
You can add a 2D/3D Graph from context menus:
Insert > Plot > 2D / 3D
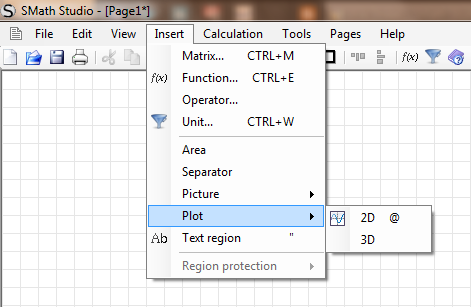
- A 2D Graph can be added directly typing '@'
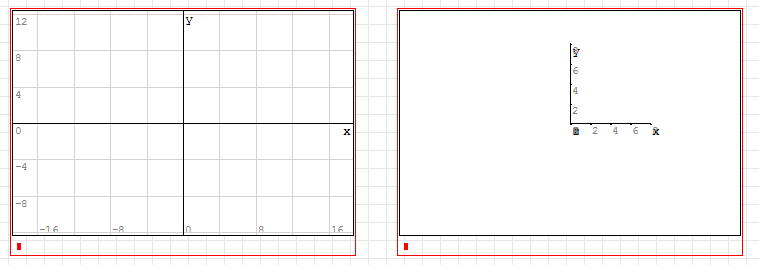
Now an empty graph will be added:
Plot equations
Variables to plot equations must be:
- 'x' and/or 'y' for 3D graphs
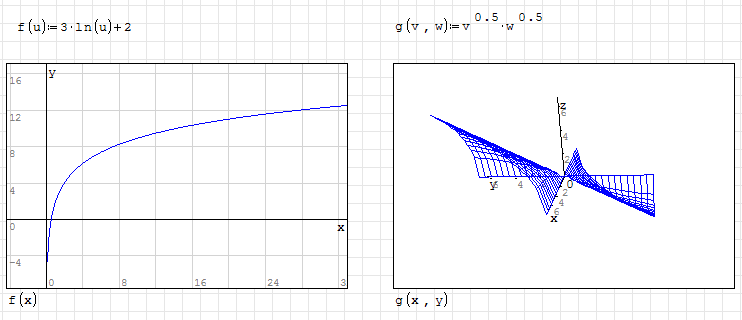
You have multiple ways to plot equations:
Directly from the plot window
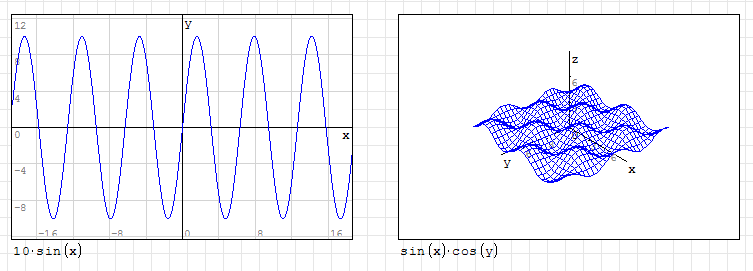
Indirectly, building your equation outside the plot window
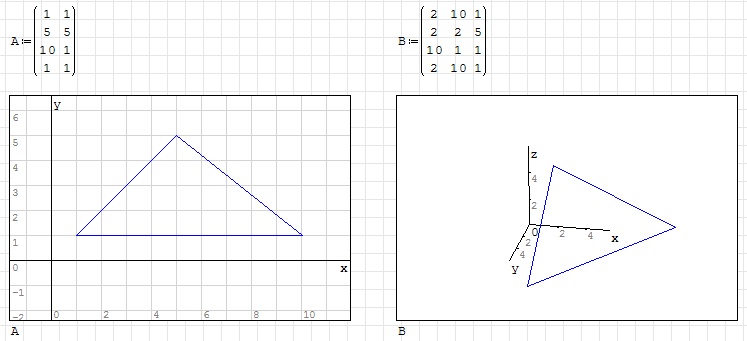
Plot matrices
You can plot figures from
matrices (directly or indirectly):
- 2 columns matrices for 2D plots
- 3 columns matrices for 3D plots
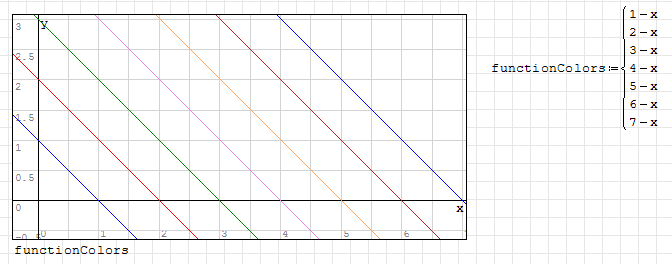
Multiple plots
You can plot multiple equations/matrices on the same graph using the 'Multiple values' item
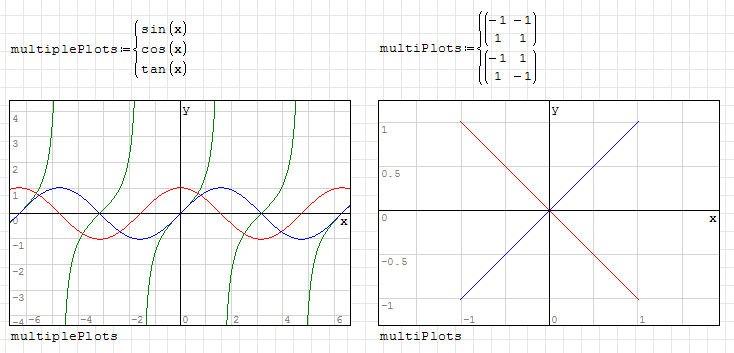
Each "value" will be colored differently (cycling between 6 colours: blue,red,green,magenta,orange and brown)
Special plots (Words,Points,etc...)
under constructionAnimated plots
See
animationsPlot handling
under constructionHints
Zooming is done with the zoom tool. If you roll your mouse wheel it zooms both axes together. If you hold 'control' at the same time it just zooms the vertical axis, and if you use 'shift' and the mouse wheel it zooms the horizontal axis.
Plot more than one curve by using the
Equation systems button on the
Functions toolbox.
Multiple values (Equation systems) don't need arguments if you use standard plot variables
Examples of 2D & 3D graphs v0.85(pdf) Animations