X-Y Plot Region - Extends SMath Studio with a X-Y Plot Region. - Messages
http://sharpgraphlib.sourceforge.net/
Thanks!!

WroteUni, this c# library might be of your interest if you plan to support interactive charts :
http://sharpgraphlib.sourceforge.net/
Thanks!!
Yes, I plan to do a little interactivity. If you find something similar for 3D, then let me know in the topic 3DPlot plugin. There you can rotate the graph.
Linear, Log axis selection
Other kinds of plots, in addition to line
Smoothing of graph
Mathematical operations
Please see the SCIDAVIS
http://scidavis.sourceforge.net/
Thank you,
Basile
WroteUni,
Linear, Log axis selection
Other kinds of plots, in addition to line
Smoothing of graph
Mathematical operations
Please see the SCIDAVIS
http://scidavis.sourceforge.net/
Thank you,
Basile
I remember, remember, don't worry


I wonder if you might include some kind of shading area between two curves for your XY plot plugin, or between the curve and the x asix, some kind of polygon feature. This could be quite useful in shading areas of density functions in statistical examples, tests and teaching in addition to using SMathViewer.
Just curious
Regards,
Radovan
Wrote
Hello uni,
I wonder if you might include some kind of shading area between two curves for your XY plot plugin, or between the curve and the x asix, some kind of polygon feature.
Something like this ? Note the semitransparent overlapping :
http://onertipaday.blogspot.com.es/2007/04/highlight-overlapping-area-between-two.html
http://onertipaday.blogspot.com.es/2008/12/statistical-visualizations.html
http://onertipaday.blogspot.com.es/2007/04/how-to-superimpose-histograms.html
http://en.smath.info/forum/yaf_postsm8829_improvement-to-plots.aspx
these two webapp graphers have interesting interactivity features:
http://graphr.org/
http://graph.tk/
http://msdn.microsoft.com/en-us/magazine/ff714591.aspx
I tried some line styles in xy-plots, here the impressions:
The line patterns (solid, dash...) are hardly distinguishable for line thickness 1. With increased thickness their appearance seems to depend on curvature or slope
If there is an option in the plot library to set line ends to round, I would recommend to use it. Currently we have chains of rectangles, that show gaps at slope changes when set to higher thickness values.
I would recommend to provide defaults for
- line colors (perhaps matching the internal smath 2D plot region)
- legend entries (text representation of the plotted expressions (list elements)
By the way, I still do not manage to control the limits using sheet variables :-(
Martin
Stylesdemo.sm (10.26 KiB) downloaded 1412 time(s).
WroteUni, your XYPlot plugin is an amazing job! Really is an extraordinary solution for wonderful graphics!
Don't forget Jack Xu, 80% of the code is taken from his book.
WroteHi,
I tried some line styles in xy-plots, here the impressions:
The line patterns (solid, dash...) are hardly distinguishable for line thickness 1. With increased thickness their appearance seems to depend on curvature or slope
If there is an option in the plot library to set line ends to round, I would recommend to use it. Currently we have chains of rectangles, that show gaps at slope changes when set to higher thickness values.
I would recommend to provide defaults for
- line colors (perhaps matching the internal smath 2D plot region)
- legend entries (text representation of the plotted expressions (list elements)
Ok, I'll see what I can implement.
Wrote
By the way, I still do not manage to control the limits using sheet variables :-(
I forgot about the regional settings. Apparently it works with dot as decimal separator. But I'm not sure this is a good way to control the settings of the chart.
Wrote
Wrote
By the way, I still do not manage to control the limits using sheet variables :-(
I forgot about the regional settings. Apparently it works with dot as decimal separator. But I'm not sure this is a good way to control the settings of the chart.
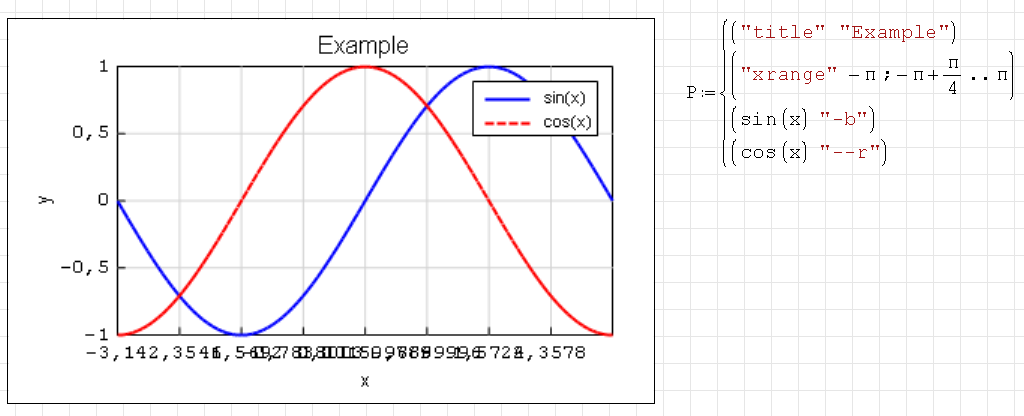
How about using line matrices as for text in the generic SMath 2D plot region? You could use spec strings like matlab or gnuplot. Ticx/limits could be handed over as vectors, perhaps generated in place using range().
I attach an example how this could look like. Would of course be fine to have the xtics symbolically...
[x] сhanged the display of the grid,
[+] mouse support,
[+] number format (not finished),
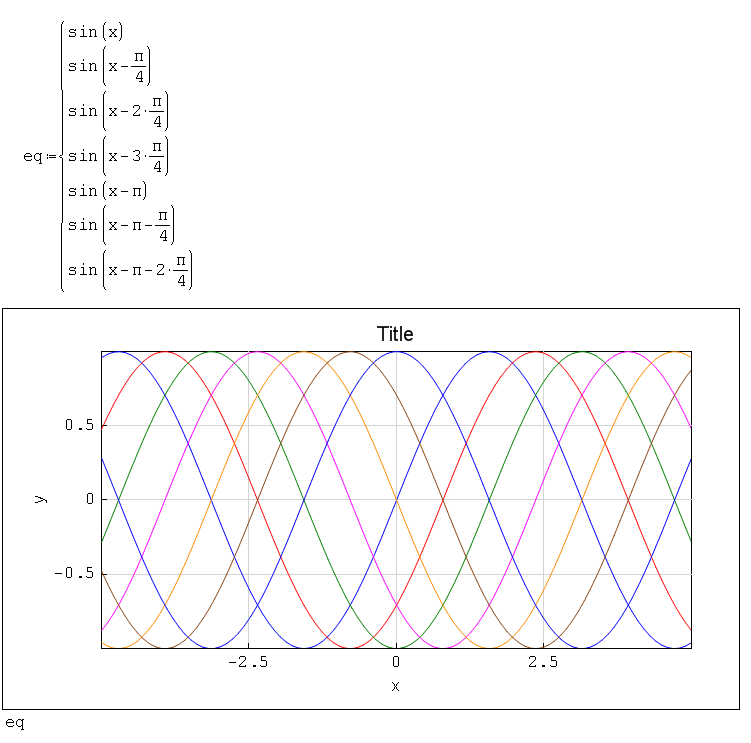
[+] drawing a line sets as a single curve,
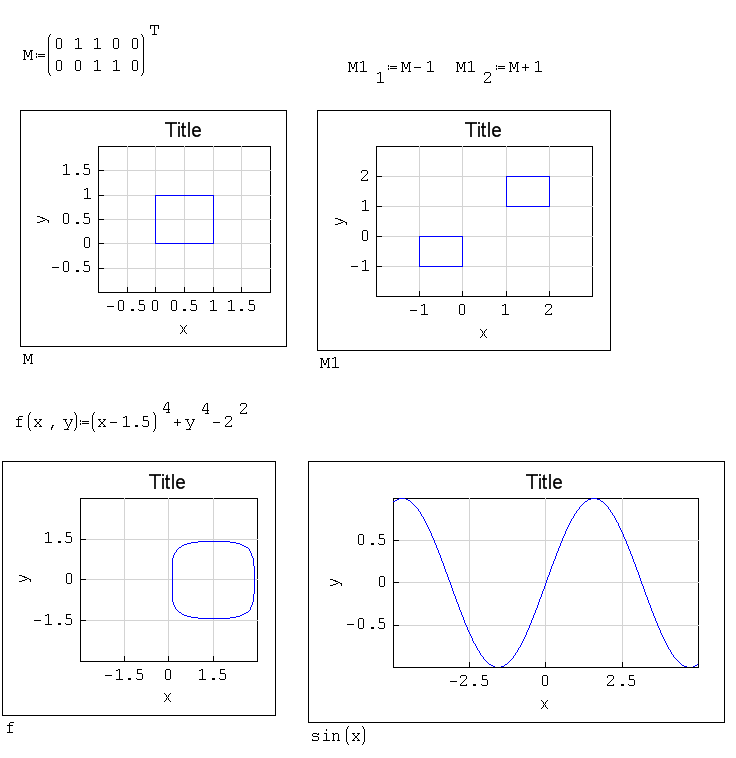
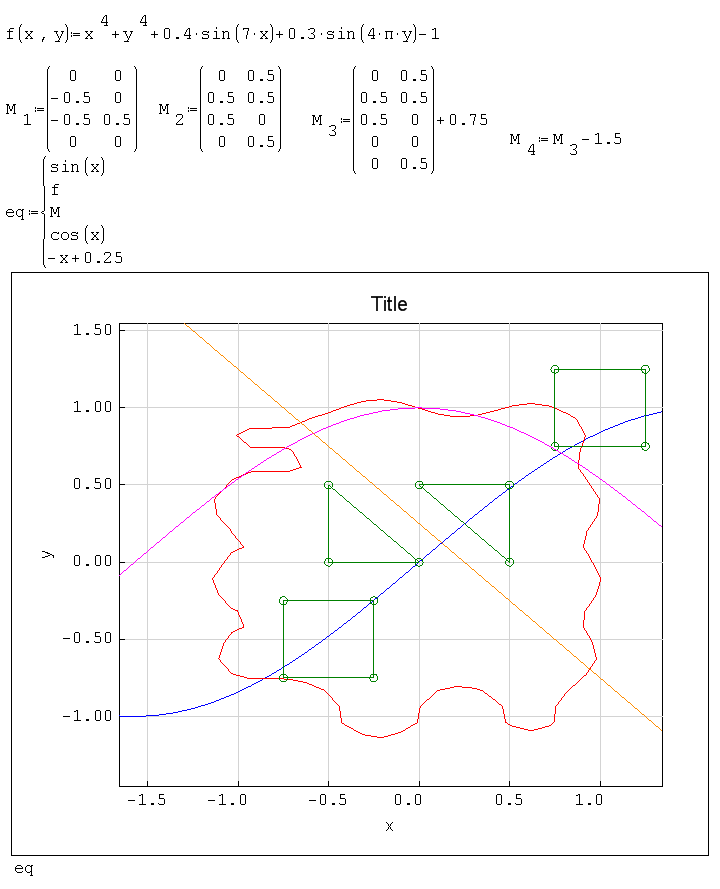
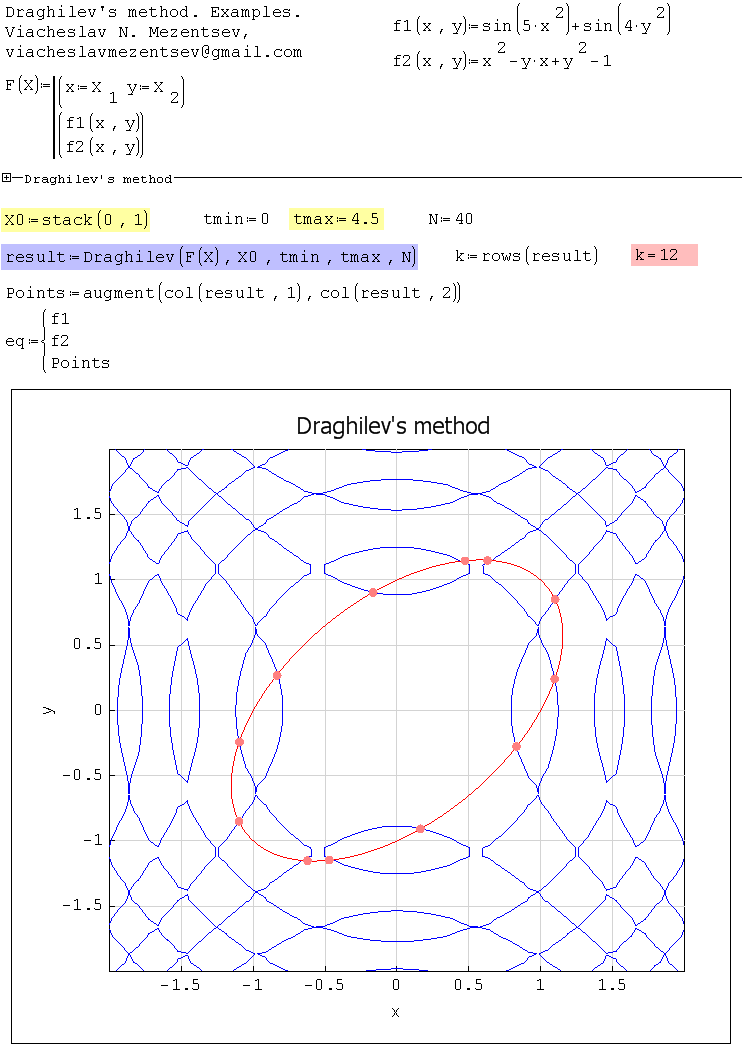
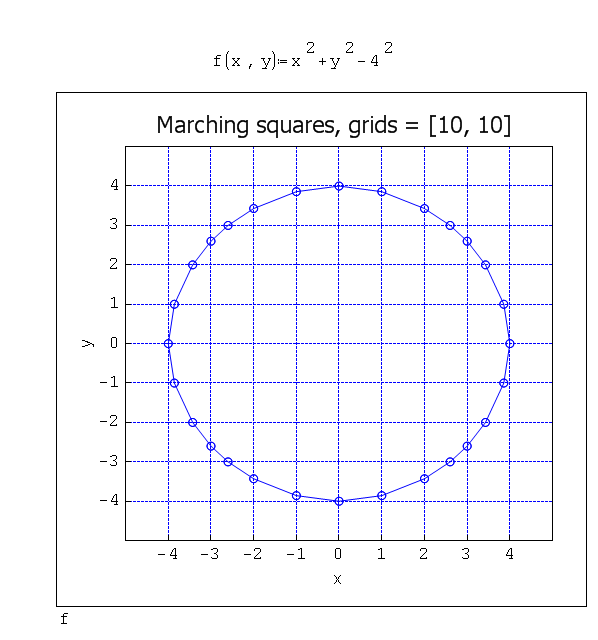
[+] support for drawing implicit functions (xgrids = ygrids = Points - 1),
[+] default colors for the first 6 datasets.
XY Plot. Example 3.sm (26.27 KiB) downloaded 1418 time(s).
Radovan
WroteUpdate. Small improvements.
uni, again exceeding expectations, thank you for the update.
If these are small improvements, what could normal improvements be...
I tried to explore the mouse support. What I can see for now:
- zoom in and out with the mouse wheel
- shift the axis ranges by dragging with the left mouse + pressing any key except shift and ctrl.
Ctrl + dragging an YXPlot with the left mouse crashes SMath. Normally that creates a copy of the region, that you can drag elsewhere.
Expressions are not accepted for implicit plots, just functions of 2 variables.
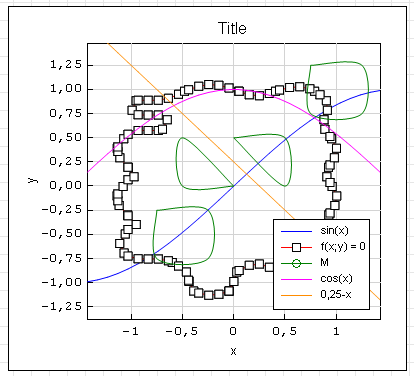
Clipping is improved, all lines reach the boundary now. I'd propose not to draw lines where both end points are outside the plotting range (at least not for auto-sampled function plots). In the attached example, the plot of 1/x shows a spurious line connecting the two branches and being quite off the correct position (that could be improved by using more sampling points in the settings dialog, it's not a bug.)
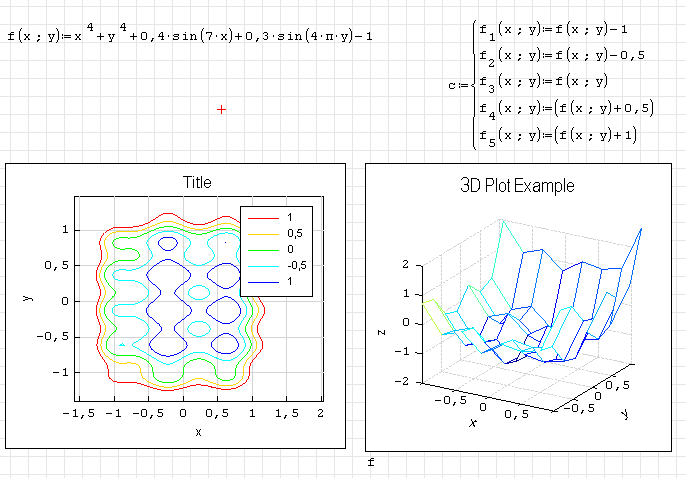
EDIT: Now real contourplots can be made...
EDIT2: (really) small issue: When clicking left on the diagram area in order to activate it, there is no visual feedback (normally, the resizing markers should appear). They come up only if there is actual action taken (resizing, mouse interaction...)
WroteWroteUpdate. Small improvements.
uni, again exceeding expectations, thank you for the update.
If these are small improvements, what could normal improvements be...
WroteCtrl + dragging an YXPlot with the left mouse crashes SMath. Normally that creates a copy of the region, that you can drag elsewhere.
I can confirm that crash. After dragging, some blue regions appeared and than crash.
I remembered that crash with CTRL+drag hapened with SMath plots as well some time ago. Can not find it on the Forum, but I am quite sure the same CTRL+drag of plots crash existed. Maybe Andrey can help to solve this out.
Best,
Radovan
WroteWroteWroteUpdate. Small improvements.
uni, again exceeding expectations, thank you for the update.
If these are small improvements, what could normal improvements be...WroteCtrl + dragging an YXPlot with the left mouse crashes SMath. Normally that creates a copy of the region, that you can drag elsewhere.
I can confirm that crash. After dragging, some blue regions appeared and than crash.
I remembered that crash with CTRL+drag hapened with SMath plots as well some time ago. Can not find it on the Forum, but I am quite sure the same CTRL+drag of plots crash existed. Maybe Andrey can help to solve this out.
Best,
Radovan
I know about it. Not found a way to fix it yet.
- If PlotMethod is set to splines, then the markers disappear (regardless of what is plotted - matrix, function, grid-based contourline (implicit plot)).
- The marker density of implicit plots is too high. Perhaps a sort of marker spacing parameter would be sensible. Could just be a number i, such that every i-th point is marked. This could be an global option, which could be overwritten by a by trace option.
- EDIT: Non-default setting (spline) of PlotMethod is not preserved upon save/load and upon copy/paste
Wrote
- The marker density of implicit plots is too high. Perhaps a sort of marker spacing parameter would be sensible. Could just be a number i, such that every i-th point is marked. This could be an global option, which could be overwritten by a by trace option.
It's hard to do. Symbol density depends on the density of points. But it depends on the algorithm used and the type of function. I'm using the marching squares algorithm that generates a set of segments on the grid cells. Each segment - two points at the ends of the segment. More cells - more points, and hence more symbols. The segments are drawn independently from each other.
- New Posts
- No New Posts