X-Y Plot Region - Extends SMath Studio with a X-Y Plot Region. - Messages
#681 Posted: 8/24/2025 9:22:13 PM
OK, this is my proposal for the add element menu. This feature reduces the space required for on X-Y plot in handbooks a lot.
Axis marker (if not migrated to Format dialog)
Basic Elements
random rolygon with 4 points
polygon with markers (demonstrate the augment(P, "x") method)
group of polygons
centered point markers (a sample of every available shape)
simple text (standard 2D style)
text with extended formatting
Functions (perhaps with random or cyclic selection of examples, as now implemented for implicit and parametric)
explicit
implicit
parametric
Shapes
Whatever is available, possibly with properly transposed matrices in order to not extend vertically over several pages, as in your example document.
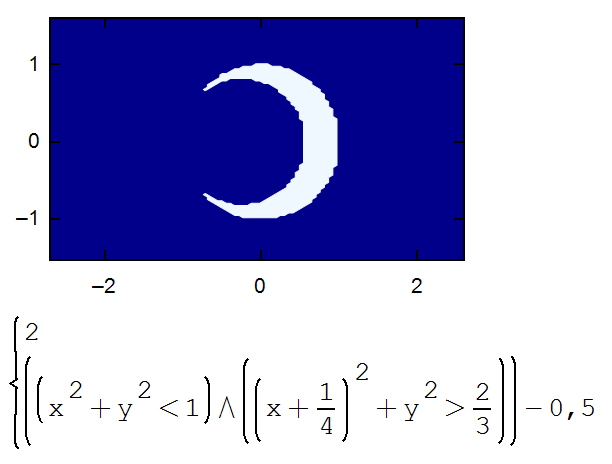
Also, for implicit plots I' suggest a choice of "above" or "below". Possibly default to "above" and allowing for expressions with relational operators.
x^2+y^2<1
x^2+y^2>1
The image below is a bit rough because the expression just switches between -0.5 and 0.5
Axis marker (if not migrated to Format dialog)
Basic Elements
random rolygon with 4 points
polygon with markers (demonstrate the augment(P, "x") method)
group of polygons
centered point markers (a sample of every available shape)
simple text (standard 2D style)
text with extended formatting
Functions (perhaps with random or cyclic selection of examples, as now implemented for implicit and parametric)
explicit
implicit
parametric
Shapes
Whatever is available, possibly with properly transposed matrices in order to not extend vertically over several pages, as in your example document.
Also, for implicit plots I' suggest a choice of "above" or "below". Possibly default to "above" and allowing for expressions with relational operators.
x^2+y^2<1
x^2+y^2>1
The image below is a bit rough because the expression just switches between -0.5 and 0.5
Technische Mechanik mit SMath Studio: https://link.springer.com/book/10.1007/978-3-658-50592-9
#682 Posted: 10/16/2025 4:22:41 PM
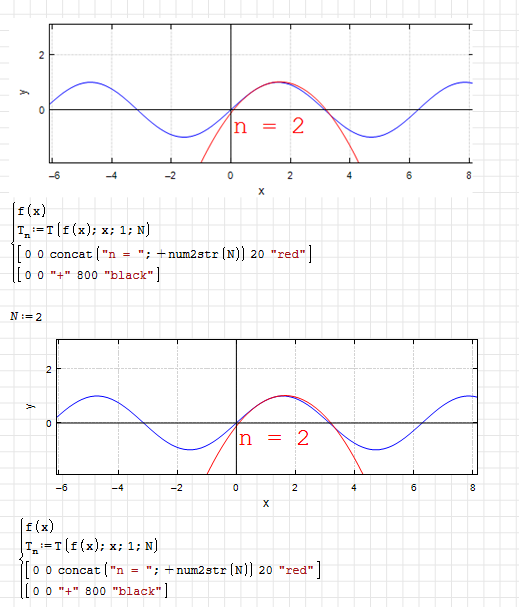
There is a rendering glitch in animations. If the y2-axis is not activated, then the corresponding frame line is missing in animation mode.
Also, if the region is cloned, the animation settings get lost and there is an error message "limits must be integer".
Taylor.sm (20.05 KiB) downloaded 807 time(s).
Also, if the region is cloned, the animation settings get lost and there is an error message "limits must be integer".
Taylor.sm (20.05 KiB) downloaded 807 time(s).
Technische Mechanik mit SMath Studio: https://link.springer.com/book/10.1007/978-3-658-50592-9
1 users liked this post
Вячеслав Мезенцев 10/23/2025 5:20:59 PM
#683 Posted: 10/29/2025 3:22:16 PM

#684 Posted: 11/6/2025 7:19:20 PM

Plugin updated.
Changes:
- fixed the problem with cloning animation properties.
As for the drawing bug, it's more difficult to fix for now.
Russia ☭ forever, Viacheslav N. Mezentsev
1 users liked this post
sergio 11/6/2025 7:33:39 PM
#685 Posted: 3/16/2026 8:06:38 PM
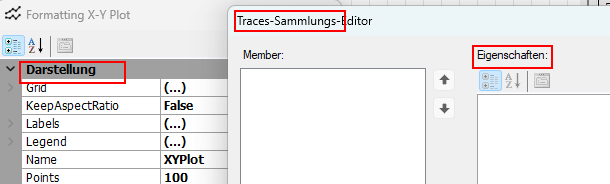
There are some language glitches in the format dialog. Some annotations are shown in German even if the program is set to English and the program was started like this and the region was created in this mode. The system language is German.
This problem prevents me to create correct screenshots for the English version of my book on SMath. I am not sure what happens when I switch the Windows language (never touch a running system).
SMath Studio: SMath Studio Enterprise 1.3.0.9126 portable, 64-bit
OS: Microsoft Windows NT 10.0.26100.0; Windows 10 Enterprise LTSC 2024, 64-bit
Screen: 1920x1080 px, 96x96 dpi, 96 GP.CDPI
Localization: language=ENG; dec.symbol=; arg.separator=; OS dec.symbol=; OS arg.separator=; OS d.g.separator=; units=eng;
Framework: CLR 4.0.30319.42000
installed versions:
v4
Client 4.8.09032
Full 4.8.09032
v4.0
Client 4.0.0.0
Plugins:
- [AppDir] AreaRegion - 1.73.9126.0
- [AppDir] HTMLFileType - 1.73.9126.0
- [AppDir] ImageFileType - 1.73.9126.0
- [AppDir] MathRegion - 1.73.9126.0
- [AppDir] PictureRegion - 1.73.9126.0
- [AppDir] PlotRegion - 1.73.9126.0
- [AppDir] SMathFileType - 1.73.9126.0
- [AppDir] SpecialFunctions - 1.73.9126.0
- [AppDir] SpecialFunctions - 1.73.9126.0
- [AppDir] StandardToolboxButtons - 1.73.9126.0
- [AppDir] TextRegion - 1.73.9126.0
- [UserDir] CheckBoxList Region - 1.0.7806.5399
- [UserDir] CheckBoxRegion - 1.0.9141.26639
- [UserDir] Combobox Region - 0.1.7806.5423
- [UserDir] ComboBoxList Region - 1.0.8763.41296
- [UserDir] Conditionally Formatted Label - 1.0.8138.35464
- [UserDir] CoolProp Wrapper - 6.4.8214.13502
- [UserDir] CustomFunctions - 1.2.9372.30444
- [UserDir] Data Exchange - 1.1.7813.24580
- [UserDir] Development Tools - 1.1.7490.41956
- [UserDir] DotNumerics - 1.1.8269.16536
- [UserDir] Excel Files Plugin - 1.3.7832.3161
- [UserDir] Excel Input-Output Functions - 1.1.8225.33532
- [UserDir] FFTPACK - 1.1.7563.3712
- [UserDir] GNU Scientific Library (GSL) - 2.7.8829.21568
- [UserDir] GPCWrapper - 1.0.9161.7296
- [UserDir] Hyperlink Region - 1.0.7806.5225
- [UserDir] Image Region - 2.100.9141.40696
- [UserDir] include - 0.2.8085.37792
- [UserDir] Mathcad File Access Functions - 1.0.8011.30679
- [UserDir] Mathcad Toolbox - 0.6.9367.4182
- [UserDir] Mathcad Toolbox - 0.6.9367.4182
- [UserDir] MatrixExtensions - 1.0.8302.28555
- [UserDir] MaximaPlugin - 1.98.8797.27896
- [UserDir] Modeller Region - 1.0.8763.37680
- [UserDir] Nonlinear Solvers - 1.1.7097.23301
- [UserDir] Numeric Up-Down Region - 1.0.8763.41162
- [UserDir] PDF Files Plugin - 1.0.7097.27694
- [UserDir] RadioButtonList Region - 1.0.8763.40835
- [UserDir] Slider Region - 1.0.9041.20211
- [UserDir] SnapshotRegion - 1.1.9308.28020
- [UserDir] Statistical Tools - 1.0.9201.22240
- [UserDir] Table Region - 0.3.8770.23606
- [UserDir] TeX File Type - 0.2.7097.30337
- [UserDir] Text Region Utilities - 0.4.7802.40621
- [UserDir] ViewerFileType - 1.1.9099.39268
- [UserDir] Writer Region - 0.23.8034.36139
- [UserDir] XlsxImportExport - 1.3.7845.24796
- [UserDir] XMCDFileType - 1.13.9019.2329
- [UserDir] X-Y Plot Region (JXCharts) - 0.4.9441.40064
- [UserDir] X-Y Plot Region (JXCharts) - 0.4.9441.40064
- [UserDir] ZedGraph Region (ZedGraph) - 0.1.7806.5613
This problem prevents me to create correct screenshots for the English version of my book on SMath. I am not sure what happens when I switch the Windows language (never touch a running system).
SMath Studio: SMath Studio Enterprise 1.3.0.9126 portable, 64-bit
OS: Microsoft Windows NT 10.0.26100.0; Windows 10 Enterprise LTSC 2024, 64-bit
Screen: 1920x1080 px, 96x96 dpi, 96 GP.CDPI
Localization: language=ENG; dec.symbol=
Framework: CLR 4.0.30319.42000
installed versions:
v4
Client 4.8.09032
Full 4.8.09032
v4.0
Client 4.0.0.0
Plugins:
- [AppDir] AreaRegion - 1.73.9126.0
- [AppDir] HTMLFileType - 1.73.9126.0
- [AppDir] ImageFileType - 1.73.9126.0
- [AppDir] MathRegion - 1.73.9126.0
- [AppDir] PictureRegion - 1.73.9126.0
- [AppDir] PlotRegion - 1.73.9126.0
- [AppDir] SMathFileType - 1.73.9126.0
- [AppDir] SpecialFunctions - 1.73.9126.0
- [AppDir] SpecialFunctions - 1.73.9126.0
- [AppDir] StandardToolboxButtons - 1.73.9126.0
- [AppDir] TextRegion - 1.73.9126.0
- [UserDir] CheckBoxList Region - 1.0.7806.5399
- [UserDir] CheckBoxRegion - 1.0.9141.26639
- [UserDir] Combobox Region - 0.1.7806.5423
- [UserDir] ComboBoxList Region - 1.0.8763.41296
- [UserDir] Conditionally Formatted Label - 1.0.8138.35464
- [UserDir] CoolProp Wrapper - 6.4.8214.13502
- [UserDir] CustomFunctions - 1.2.9372.30444
- [UserDir] Data Exchange - 1.1.7813.24580
- [UserDir] Development Tools - 1.1.7490.41956
- [UserDir] DotNumerics - 1.1.8269.16536
- [UserDir] Excel Files Plugin - 1.3.7832.3161
- [UserDir] Excel Input-Output Functions - 1.1.8225.33532
- [UserDir] FFTPACK - 1.1.7563.3712
- [UserDir] GNU Scientific Library (GSL) - 2.7.8829.21568
- [UserDir] GPCWrapper - 1.0.9161.7296
- [UserDir] Hyperlink Region - 1.0.7806.5225
- [UserDir] Image Region - 2.100.9141.40696
- [UserDir] include - 0.2.8085.37792
- [UserDir] Mathcad File Access Functions - 1.0.8011.30679
- [UserDir] Mathcad Toolbox - 0.6.9367.4182
- [UserDir] Mathcad Toolbox - 0.6.9367.4182
- [UserDir] MatrixExtensions - 1.0.8302.28555
- [UserDir] MaximaPlugin - 1.98.8797.27896
- [UserDir] Modeller Region - 1.0.8763.37680
- [UserDir] Nonlinear Solvers - 1.1.7097.23301
- [UserDir] Numeric Up-Down Region - 1.0.8763.41162
- [UserDir] PDF Files Plugin - 1.0.7097.27694
- [UserDir] RadioButtonList Region - 1.0.8763.40835
- [UserDir] Slider Region - 1.0.9041.20211
- [UserDir] SnapshotRegion - 1.1.9308.28020
- [UserDir] Statistical Tools - 1.0.9201.22240
- [UserDir] Table Region - 0.3.8770.23606
- [UserDir] TeX File Type - 0.2.7097.30337
- [UserDir] Text Region Utilities - 0.4.7802.40621
- [UserDir] ViewerFileType - 1.1.9099.39268
- [UserDir] Writer Region - 0.23.8034.36139
- [UserDir] XlsxImportExport - 1.3.7845.24796
- [UserDir] XMCDFileType - 1.13.9019.2329
- [UserDir] X-Y Plot Region (JXCharts) - 0.4.9441.40064
- [UserDir] X-Y Plot Region (JXCharts) - 0.4.9441.40064
- [UserDir] ZedGraph Region (ZedGraph) - 0.1.7806.5613
Edited 3/16/2026 8:13:45 PM
Technische Mechanik mit SMath Studio: https://link.springer.com/book/10.1007/978-3-658-50592-9
#686 Posted: 3/17/2026 12:57:57 PM
The problem is that the dialog box forms aren't part of the plugin. They're standard components that use system localization. I replace some labels at runtime, but these are special cases.
Ideally, I should create custom localization, but that's currently impossible. I use Russian and English where available. The rest of the components use system localization.
The dialog boxes for curve properties are created at runtime, and I don't have access to them during design. In the future, I'd like to move away from these forms and use my own localized ones, but it's unclear how to do this with the program's existing tools.
I can't currently fix anything while the server is migrating to a different version control system.
P.S. I could try changing the dialog form's environment when it launches, but I'm not sure that will work. In any case, we need to wait for the git repository and tools to become available.
Edited 3/17/2026 1:06:37 PM
Russia ☭ forever, Viacheslav N. Mezentsev
1 users liked this post
Martin Kraska 3/17/2026 5:33:44 PM
#687 Posted: 3/18/2026 9:31:38 AM
Hi Martin. One workaround is to add a new user to Windows, which you can configure in English (and also use a comma as the argument separator and a period as the decimal sign). In this way, your German system wouldn't be affected, and the XYPlot plugin should display the dialog boxes in English with that new user. Or at least that's how it should work in theory.
Also, there's a way to add a new user "without an account," which speeds up the process because it doesn't require an email address or other details, but I don't remember exactly how to do it.
Best regards.
Alvaro.
Also, there's a way to add a new user "without an account," which speeds up the process because it doesn't require an email address or other details, but I don't remember exactly how to do it.
Best regards.
Alvaro.
1 users liked this post
Martin Kraska 3/18/2026 12:47:29 PM
- New Posts
- No New Posts