1 Pages (8 items)
Graphing using functions as both the x and y axis. - Messages
#1 Posted: 5/11/2011 4:56:14 PM
I have found the need to graph the torque of an engine compared to the crank angle ie, torque vs. angle graph. I have been unable to figure out how make the torque equation be the y axis. I think having that ability is necessary component for software like this. I am very happy with this software but it needs to be able to have the same graphing capabilities as mathcad to be a replacement for mathcad.
thanks and i look forward to hearing a responce!
Justin
thanks and i look forward to hearing a responce!
Justin
#2 Posted: 5/12/2011 9:31:34 AM

Please, could you post your code and desired result?
Thanks
Thanks
#3 Posted: 5/12/2011 10:43:24 AM
I cannot post the code becuase I am out of the office today. However, the question is, does smath have the ability to have a user defined function for both axes of a 2d graph. For example, I want to have the x-axis (crank angle) start at 0 and go until some maximum value (which i noticed someone else has mentioned in this forum) and on the y axis be the function I created that is dependent on the x-axis.
x-axis is a range of values x=1,2..360
y-axis is a function of x y=f(x)
x-axis is a range of values x=1,2..360
y-axis is a function of x y=f(x)
#4 Posted: 5/12/2011 11:36:14 AM
ok, maybe that is you want:
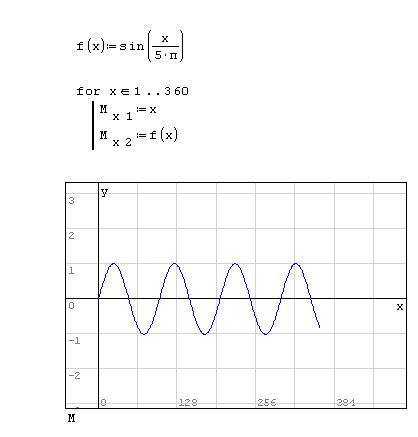
#5 Posted: 5/12/2011 12:12:27 PM
This could work. But What is the point of having the subscripts of x1 and x2 under the M. That may be a dumb question but i am new to this software. And I would have thought to type Mx2 in plot. why wouldn't you? You had just put M.
#6 Posted: 5/12/2011 1:08:50 PM
Ok, M is a matrix where the first column are x values and the second column are y values. Observe that in "for..." cycle I assign values row by row to each column. The plot function plots the first column as "x" and the second one as "y".
#7 Posted: 11/10/2011 2:17:11 PM
I have tried this graphing function but i failed many times so please have a look :
1. The problem statement, all variables and given/known data
plot x(t) = 10cos((pi*t)-(pi/4))
2. Relevant equations
pi/4 is the shift to the right
10 is the amplitude of the graph
pi is the radian frequency
3. The attempt at a solution
so i got the amplitude and shift to the right by pi/4 part but as for the radian frequency, my plot doesnt seem right. does pi mean that one cos wave occurs in a pi interval? thanks in advance
1. The problem statement, all variables and given/known data
2. Relevant equations
3. The attempt at a solution
1. The problem statement, all variables and given/known data
plot x(t) = 10cos((pi*t)-(pi/4))
2. Relevant equations
pi/4 is the shift to the right
10 is the amplitude of the graph
pi is the radian frequency
3. The attempt at a solution
so i got the amplitude and shift to the right by pi/4 part but as for the radian frequency, my plot doesnt seem right. does pi mean that one cos wave occurs in a pi interval? thanks in advance
1. The problem statement, all variables and given/known data
2. Relevant equations
3. The attempt at a solution
#8 Posted: 11/11/2011 12:42:34 AM
Your link send to wordpress page with no description about the function you are talking in your post, please fix it for help you...
1 Pages (8 items)
- New Posts
- No New Posts