1 Pages (9 items)
Graphs - please someone add more powerful graph functionality! - Messages
#1 Posted: 2/1/2018 8:13:59 AM
Hi,
I was very glad to find this SMath lately that has nearly everything covered I used previously in MC. But I cannot believe that the plotting functionality is stuck in a very rudimentary form. Not beeing able to set the axis limits programmatically but only by scrolling is truly a p-i-t-a! Displaying a sine between -10 and 10 is for school kids. If my data's x-region is between 1000000 and 1000010 or between 1E-9 and 1.0001E-9 I have to scroll like crazy to find the graphs. Sorry. And logarithmic axis scaling is a must too. And I liked actually MCs ability to use some range variable to define the x-axis and using y-vectors without having to create matrices out of every y-vector.
People have made so many extensions to SMath, could someone please please integrate a plot region with basic functionality!
Or at least add a rescale button to zoom into the used ranges...
1 users liked this post
frapuano 2/2/2018 5:24:00 AM
#2 Posted: 2/1/2018 8:32:49 AM
Try a search for SMath Studio Handbuch and follow the link in my signature.
Technische Mechanik mit SMath Studio: https://link.springer.com/book/10.1007/978-3-658-50592-9
#3 Posted: 2/1/2018 2:21:13 PM
You have a good point compared to MCD.
For those plots that don't plot unless you find the region.
you can use the X_Y plot, range the 'x', 'y' at will.
On the other hand, MCD [at least up to 15] couldn't be size
properly. Handles were ½ pica [6 pixels]. Smath QuickPlot
is on pixel and all plots can be sized exactly the same.
On the other hand, Smath QuickPlot provides the finest plot
on the market [OriginLab is very fine too] compared to Mathcad
up to 15 that can't produce fine plot based on ½ pica.
There are very many more instances Smath plot are superior
to MCD was ... Smath solve lot of stuff directly on the canvas.
Personally, I hate Smath on very small values ordinates.
#4 Posted: 2/1/2018 2:29:50 PM
Please, visit "Thermal Physics..." posted last minute.
Observe the X_Y plot easy settings X, Y axes.
Observe the X_Y plot easy settings X, Y axes.
#5 Posted: 2/1/2018 11:31:31 PM
WrotePeople have made so many extensions to SMath, could someone please please integrate a plot region with basic functionality!
Or at least add a rescale button to zoom into the used ranges..
You are asking a lot for this magnificient freeware that does nearly as much maths
than MCD [7 ... 15] Your huge numbers + little, X_Y plot will not like at all and
will risk crash. You can always scale the results to more reasonable values.
I fact, maths exist only in the range 0 .. 1
The attached shows the water density [kg/m³ <= °C] in the very low range
X_Y plot is just gorgeous for that.
The Water bar saturation shows how to use logpts to export data adequately
populated in the low range. We used the same in Mathcad.
Cheers
Inst_Water [kg_m3].sm (55.06 KiB) downloaded 1170 time(s).
Inst_Water bar Saturation [tdegC].sm (51.69 KiB) downloaded 1154 time(s).
#6 Posted: 2/2/2018 5:37:36 AM
I agree completely with the request of Propmark and my modest opinion is the following; as soon as it as been consolidated this period of development mainly devoted to the improvements on the documents formatting part of the documents in Smath I guess that same time has to be devoted to improvements of on the Graphs side both on the default types mode made available and both making some internal improvements (API ? or other aspects of the Smath engine I am not a master about) that will allow Uni or other people that have developed several Graph oriented Plug-in to push further ahead their development( at least is what I have understood reading several forum part devoted to this topic ) .
Best regards
Franco
Best regards
Franco
#7 Posted: 2/2/2018 6:08:34 AM

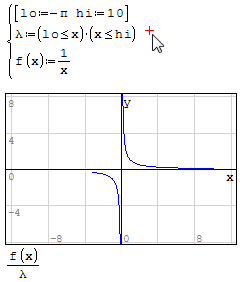
about limits, from the discusion on integration with microMathematics Plus 
Also, I'm working to create a set of 2D charts with common features, first planned is a bar chart:
![2018-01-30 19_52_47-SMath Studio - [Page1_].png](/en-US/files/Download/qBxYM2/2018-01-30-19_52_47-SMath-Studio---[Page1_].png)
![2018-01-30 19_49_16-SMath Studio - [Page1_].png](/en-US/files/Download/MwHpYo/2018-01-30-19_49_16-SMath-Studio---[Page1_].png)
WroteAnd also (less visible for end users):
Internally built-in Graphs now supports plots visualization with respect to limits set for axes.
Also, I'm working to create a set of 2D charts with common features, first planned is a bar chart:
If you like my plugins please consider to support the program buying a license; for personal contributions to me: paypal.me/dcprojects
3 users liked this post
Radovan Omorjan 2/2/2018 6:49:00 AM, frapuano 2/2/2018 9:38:00 AM, Вячеслав Мезенцев 2/2/2018 12:45:00 PM
#8 Posted: 2/2/2018 9:12:00 AM
Thank you for all your responses, I'll need some time to try out the recommendations like X_Yplot, Maxima-Draw2D and so on...
1 Pages (9 items)
- New Posts
- No New Posts