1 Pages (9 items)
XY-PLOT Logarithmic scale - does anyone know how to create a graph with a logarithmic scale on the "Y" axis? - Messages
#1 Posted: 5/1/2021 9:59:24 AM

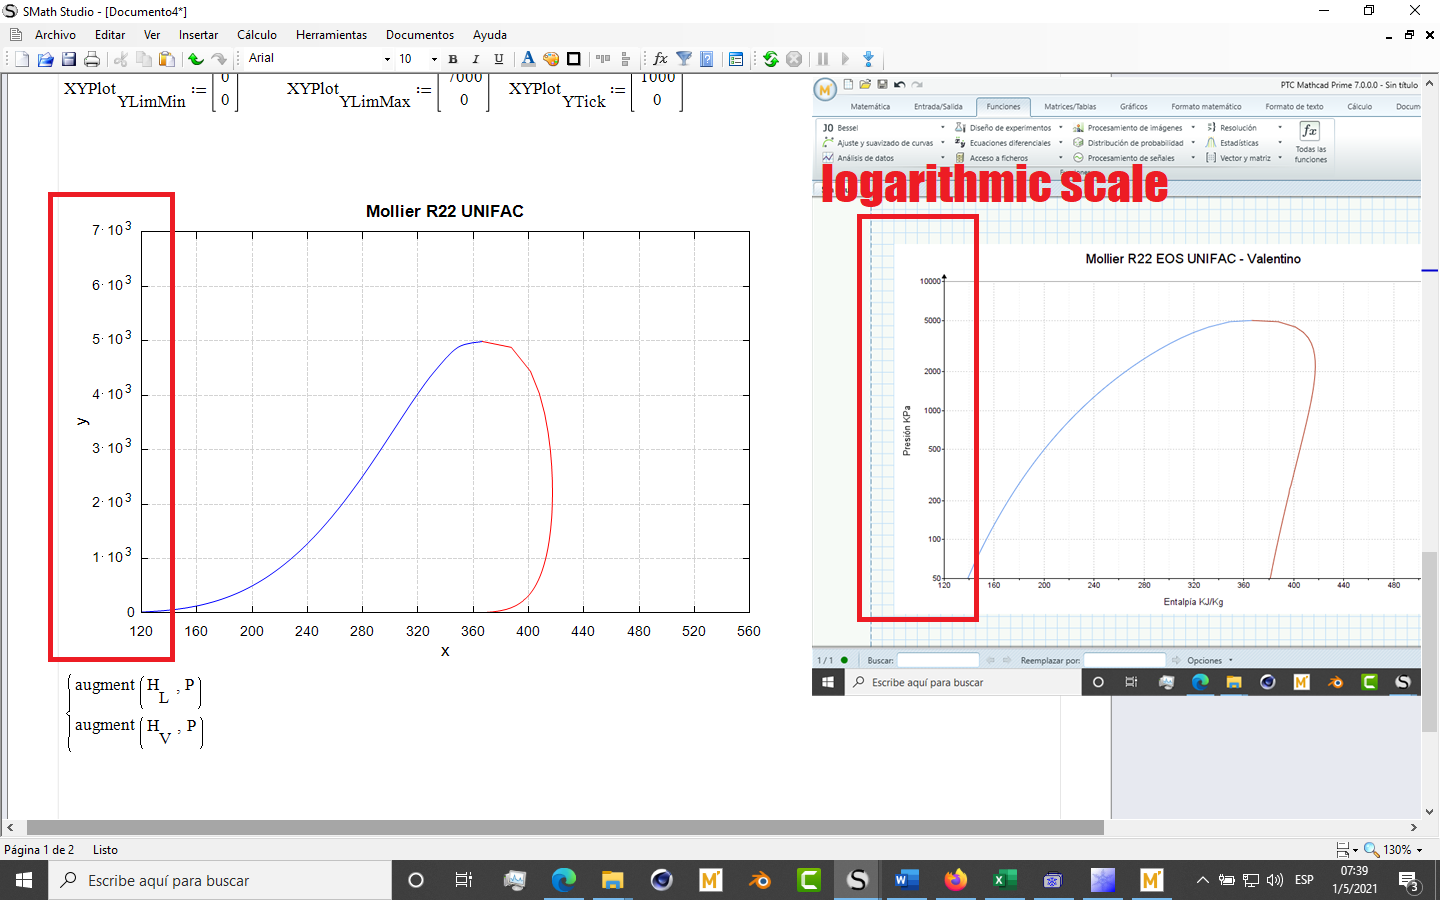
hi  does anyone know how to create a graph with a logarithmic scale on the "Y" axis? I want to make an enthalpy vs pressure diagram, has anyone already made a Mollier diagram? constant entropy lines are costing me a lot of work. Thanks for your attention
PH.sm (214.23 KiB) downloaded 1041 time(s).
does anyone know how to create a graph with a logarithmic scale on the "Y" axis? I want to make an enthalpy vs pressure diagram, has anyone already made a Mollier diagram? constant entropy lines are costing me a lot of work. Thanks for your attentionPH.sm (214.23 KiB) downloaded 1041 time(s).

#3 Posted: 5/1/2021 1:19:22 PM
Maxima plug-in should work too.
#4 Posted: 5/1/2021 1:26:36 PM
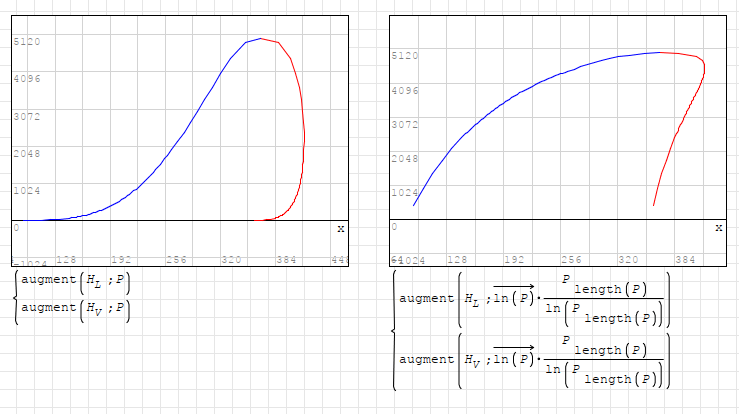
Integrated 2D plot should work too.
Same can be said for XY-Plot plugin.
With a little trick of course.
logarithmic_plot.sm (13.69 KiB) downloaded 1036 time(s).
Same can be said for XY-Plot plugin.
With a little trick of course.
logarithmic_plot.sm (13.69 KiB) downloaded 1036 time(s).
#5 Posted: 5/6/2021 7:08:18 AM
WroteYou can do with the Zedgraph plugin
sergio
PH_sergio.sm (246.07 KiB) downloaded 1104 time(s).
Sergio, thank you very much for answering

The logarithmic scale worked perfectly, however, the lines that it draws are somewhat wavy, as if there is noise and they are separated,
is there any way that the line is smoother and more united? Also, when I use ZG, how can I name the lines? I entered all the tempperature
and entropy data manually
thank you very much for your attention :d
My English is not very good, I hope you can understand me

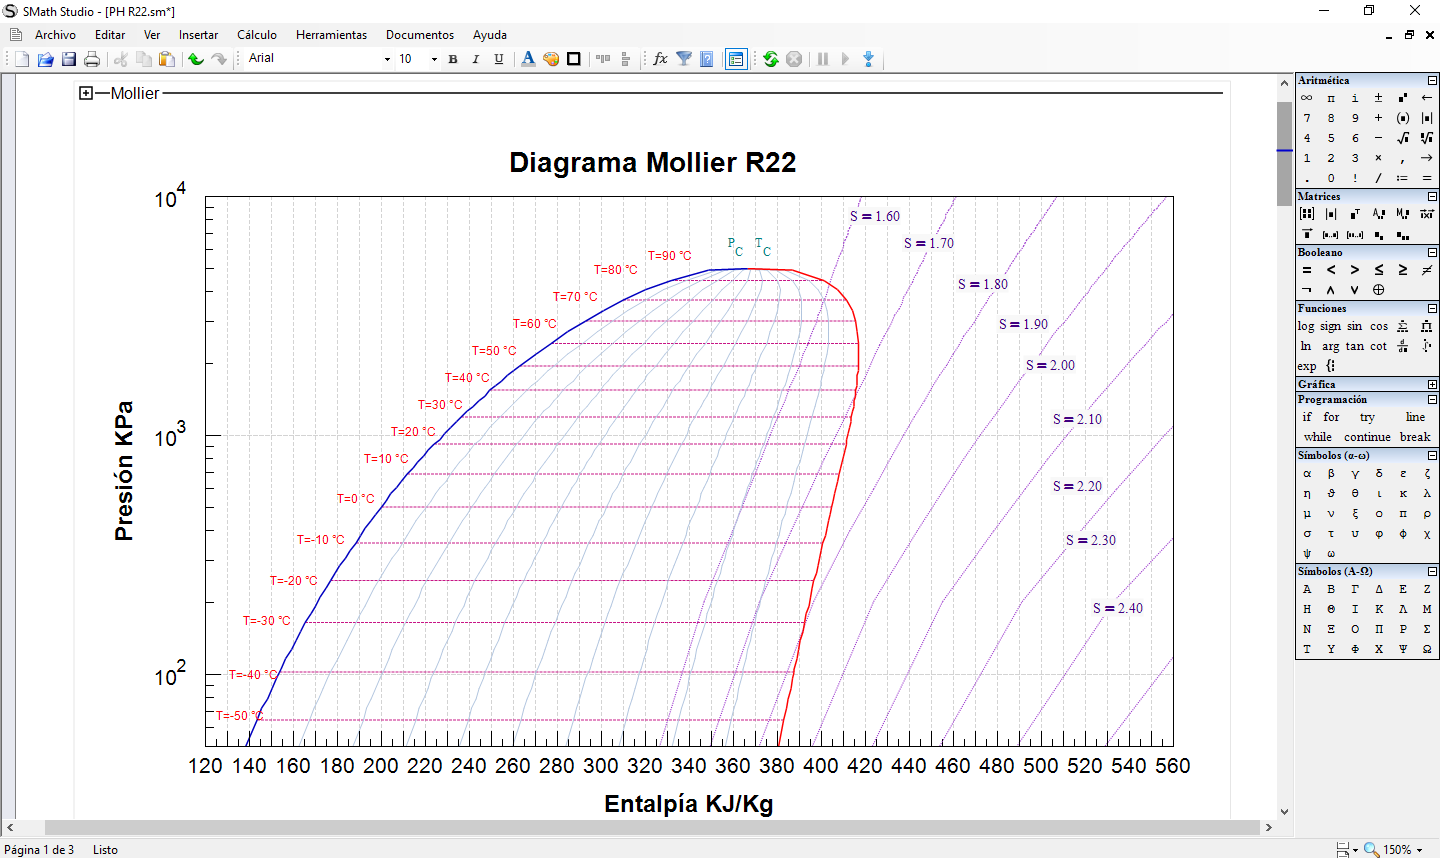
file
PH R22.sm (181.09 KiB) downloaded 1022 time(s).
#6 Posted: 5/6/2021 7:26:24 AM
WroteIntegrated 2D plot should work too.
Same can be said for XY-Plot plugin.
With a little trick of course.
logarithmic_plot.sm (13.69 KiB) downloaded 1036 time(s).
Thanks for answering, your method is very helpful.
Do you know how I can enter text for the graph lines? I entered all the temperature and entropy values manually,
I would like the text to be on the lines or on one side of the line without having to enter them as a text region.
thanks for your attention

I don't write in English, I hope you understand me

PH R22 Q.sm (179.97 KiB) downloaded 1023 time(s).
#7 Posted: 5/6/2021 2:44:11 PM
You can view all at once on collected Mollier.
PH R22 Q Mollier.sm (61.53 KiB) downloaded 974 time(s).
PH R22 Q Mollier.sm (61.53 KiB) downloaded 974 time(s).
#8 Posted: 5/6/2021 3:59:12 PM
WroteThanks for answering, your method is very helpful.
Do you know how I can enter text for the graph lines? I entered all the temperature and entropy values manually,
I would like the text to be on the lines or on one side of the line without having to enter them as a text region.
thanks for your attention
I don't write in English, I hope you understand me
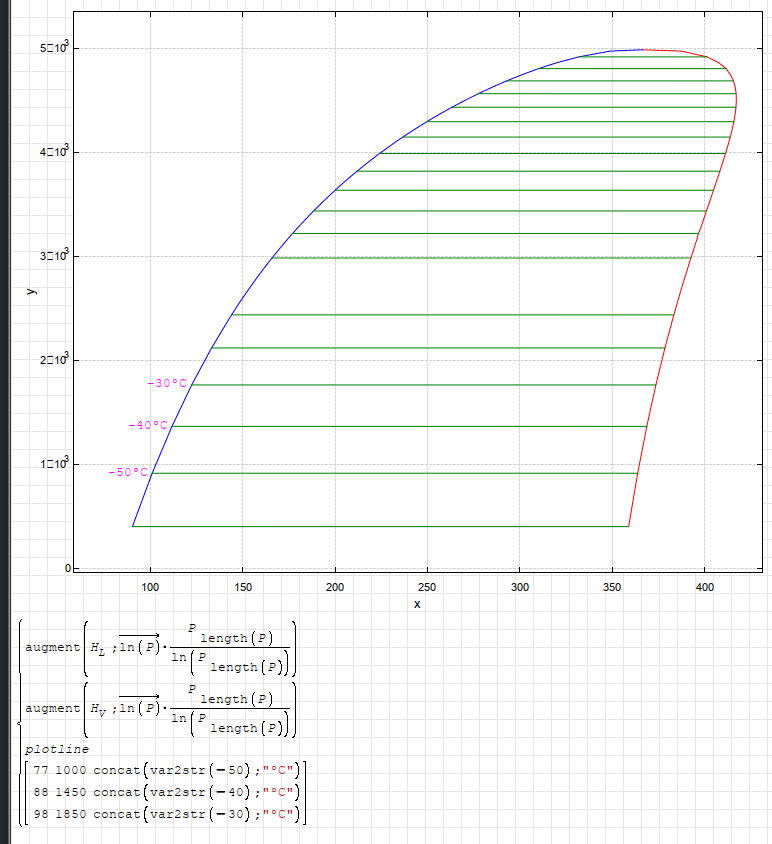
In 2D-plot and XY-plot there is a method to enter text or some marks into the graph.
Don't have any idea if this works with Zed graph.
I don't have it and I have no intention to install it.
Below you can see a simple demonstrated answer to your question.
There is also a lot of detailed information for plotting in Reference book.
Regards
logarithmic_plot_withtext.sm (32.61 KiB) downloaded 1036 time(s).
#9 Posted: 5/12/2021 9:15:04 PM
Wrotehas anyone already made a Mollier diagram? constant entropy lines are costing me a lot of work. Thanks for your attention
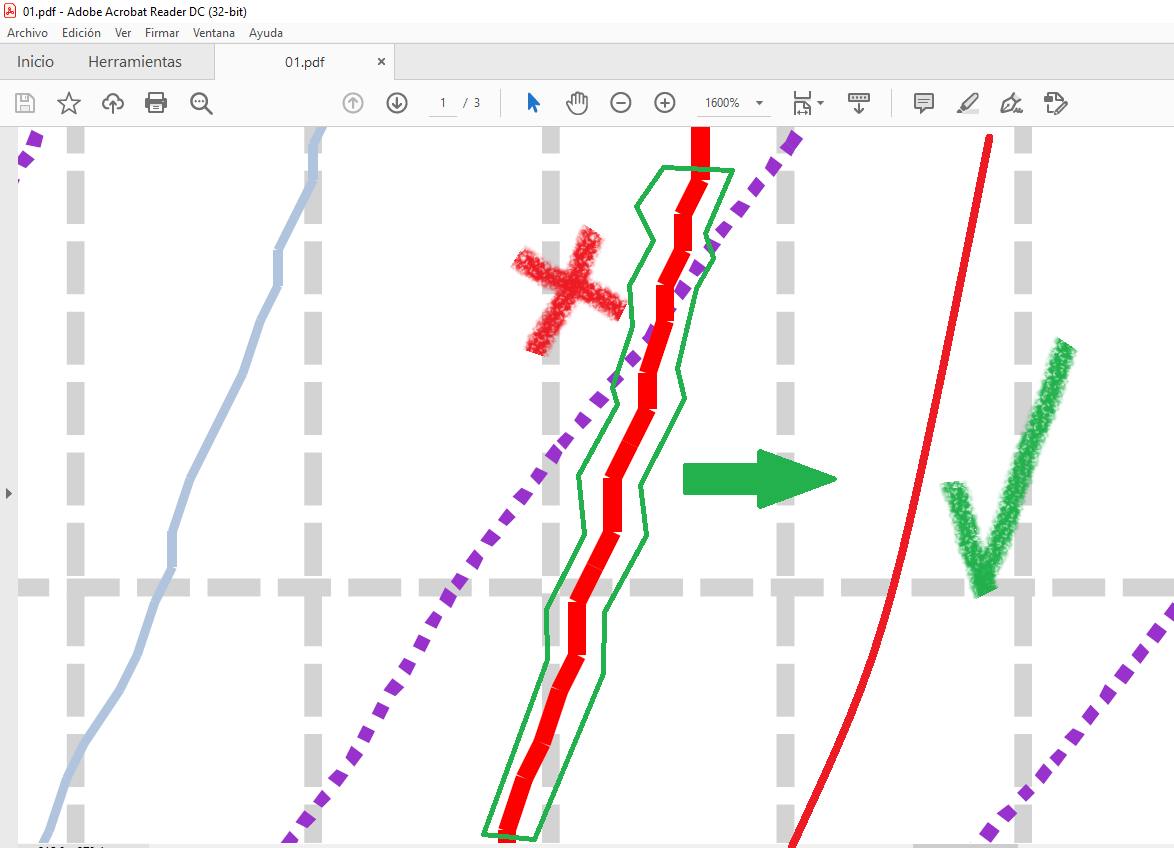
An horrible task for the first model from you data.
The principle is quite involved but works.
M8, M9, M10 do NOT cinterp ... confirmed Mathcad
Quadratic acceptable M9 ... M8 poor ... M10 OK
More work to conclude is needed ... as is reconciliation.
the FREAK is not done
Cheers ... Jean
Project Mollier IDX part.sm (163.93 KiB) downloaded 1015 time(s).
The all difficulty results from poor/unwisely collected data.
1 Pages (9 items)
- New Posts
- No New Posts