Log scale on the x axis - Messages
I have created a plot in Smath but want to change the x axis to a log scale. Any ideas on how to go about doing that. Attached is my file.filter.sm (6.06 KiB) downloaded 1008 time(s).
Regards,
Vijay Khatri
WroteI have created a plot in Smath but want to change the x axis to a log scale
What would that do transforming the visible into invisible ?
What about some Fourier spectrum suite after freaking the 'f' ?
filter.sm (12.42 KiB) downloaded 1026 time(s).
Vijay
WroteWell!!!, I am trying to do a Bode Plot. The example I am working on is a filter transfer function. Hope you can see where I am coming from. Once that's sorted out, I have to come up with the phase plot.
Bode plot on log scale X is valid for high frequencies. For low 'f' as you have,
it would rather be confusing [my opinion from years back]. On the other hand,
since around 1980, almost all systems were Digital rather than Analog.
Do you have to move a cannon rapidly, left/right ... ?
I'm more versed in Process Control & Instrumentation.
Some interesting reading attached.
Maybe latest version of Maxima has X log scale ?
Martin is the person to confirm/infirm X log scale.
Just plot the Phase as is straight, will be good enough.
Fourier BoxCar_0.sm (37.88 KiB) downloaded 1051 time(s).
Fourier BoxCar_1.sm (19.97 KiB) downloaded 1002 time(s).
Inst_PID [MCD Model].sm (177.96 KiB) downloaded 864 time(s).
WroteHi All,
I have created a plot in Smath but want to change the x axis to a log scale. Any ideas on how to go about doing that. Attached is my file.filter.sm (6.06 KiB) downloaded 1008 time(s).
Regards,
Vijay Khatri
To answer your question, I don't believe there is a way to do it with the default plotting tool. You can, however, use a plugin like Zed Graph to draw log plots. There are a lot more settings and it's a bit of a manual process, but once it's setup the way you like it looks great. See attached.
filter.sm (99.66 KiB) downloaded 1100 time(s).
WroteWroteWell!!!, I am trying to do a Bode Plot. The example I am working on is a filter transfer function. Hope you can see where I am coming from. Once that's sorted out, I have to come up with the phase plot.
Bode plot on log scale X is valid for high frequencies. For low 'f' as you have,
it would rather be confusing [my opinion from years back]. On the other hand,
since around 1980, almost all systems were Digital rather than Analog.
Do you have to move a cannon rapidly, left/right ... ?
I'm more versed in Process Control & Instrumentation.
Some interesting reading attached.
Maybe latest version of Maxima has X log scale ?
Martin is the person to confirm/infirm X log scale.
Just plot the Phase as is straight, will be good enough.
Fourier BoxCar_0.sm (37.88 KiB) downloaded 1051 time(s).
Fourier BoxCar_1.sm (19.97 KiB) downloaded 1002 time(s).
Inst_PID [MCD Model].sm (177.96 KiB) downloaded 864 time(s).
This is true in the instrumentation world, however, in the power world (Power Systems), there is no scope of digitisation when it comes to filters. Majority of the filters are passive due to very high voltage and current requirements. Your instrumentation example if very interesting, I will explore that further.
Vijay
WroteWroteHi All,
I have created a plot in Smath but want to change the x axis to a log scale. Any ideas on how to go about doing that. Attached is my file.filter.sm (6.06 KiB) downloaded 1008 time(s).
Regards,
Vijay Khatri
To answer your question, I don't believe there is a way to do it with the default plotting tool. You can, however, use a plugin like Zed Graph to draw log plots. There are a lot more settings and it's a bit of a manual process, but once it's setup the way you like it looks great. See attached.
filter.sm (99.66 KiB) downloaded 1100 time(s).
Thank you that really helps. Just a few questions, I need to duplicate the steps you took as I have to instruct my students to do the same.
How did you add the plug in (IN the example you provided, it prompted me to install the plug in). Also, do you invoke Maple plot, I tied that but did not work for me.
Vijay
Wrote
Thank you that really helps. Just a few questions, I need to duplicate the steps you took as I have to instruct my students to do the same.
How did you add the plug in (IN the example you provided, it prompted me to install the plug in). Also, do you invoke Maple plot, I tied that but did not work for me.
Vijay
To install the plugin go to Tools->Plugins. Where it says "Local Storage" click and choose "Online Gallery". Then scroll to find ZedGraph region and double click to install. Note: since you now have the ZedGraph region installed you will find it under "Local Storage".
To invoke the graph choose Insert->ZedGraph Region.
There are many setting that can be accessed by double clicking the region or Right Click -> Format.
I changed to log scale by accessing XAxis->Type and choosing Log. There were a lot of other settings I messed with to make it look like I did in the example, but I can't remember them exactly. Best method is just to play around.
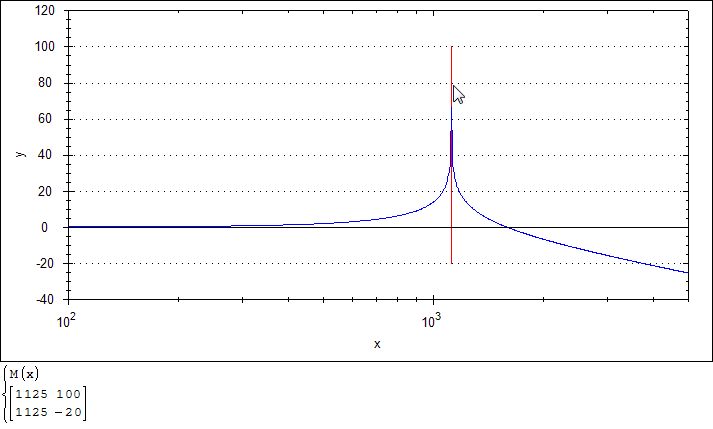
Edit: I do remember changing the number of points from 100 to 1000 in order to get the resolution I wanted. At my first attempt the resonant peak only maxed out at around 30, but it was do to the number of points being to little.
There may be other ways to do this using Maple Plot, Maxima Draw2D or perhaps XY Plot, but I'm not entirely sure. I don't often plot data, but this is the way I'm most familiar with.
WroteTo answer your question, I don't believe there is a way to do it with the default plotting tool. You can, however, use a plugin like Zed Graph to draw log plots. There are a lot more settings and it's a bit of a manual process, but once it's setup the way you like it looks great. See attached.
Thanks alyles, I love your Grand Discours, easy to follow.
The logplot is just the same as linear plot, except for the tick labels log disposed.
Most interesting, like this:
My 6179 does not come with ZedGraph, but it installed itself from opening
a work sheet that had it [from recollection Collab NDTMA version 6484].
In fact, when I open your work sheet and say YES => continue, ZedGraph is red
and few more plugins.
Long time ago, I experimented Maple plot ... happy at the construction stage,
but returned dead next session, next day ... for the birds.
I don't tell lies !
Jean
Project filter (1).sm (101.96 KiB) downloaded 1069 time(s).
WroteWrote
Thank you that really helps. Just a few questions, I need to duplicate the steps you took as I have to instruct my students to do the same.
How did you add the plug in (IN the example you provided, it prompted me to install the plug in). Also, do you invoke Maple plot, I tied that but did not work for me.
Vijay
To install the plugin go to Tools->Plugins. Where it says "Local Storage" click and choose "Online Gallery". Then scroll to find ZedGraph region and double click to install. Note: since you now have the ZedGraph region installed you will find it under "Local Storage".
To invoke the graph choose Insert->ZedGraph Region.
There are many setting that can be accessed by double clicking the region or Right Click -> Format.
I changed to log scale by accessing XAxis->Type and choosing Log. There were a lot of other settings I messed with to make it look like I did in the example, but I can't remember them exactly. Best method is just to play around.
Edit: I do remember changing the number of points from 100 to 1000 in order to get the resolution I wanted. At my first attempt the resonant peak only maxed out at around 30, but it was do to the number of points being to little.
There may be other ways to do this using Maple Plot, Maxima Draw2D or perhaps XY Plot, but I'm not entirely sure. I don't often plot data, but this is the way I'm most familiar with.
Thank you
WroteThere may be other ways to do this using Maple Plot, Maxima Draw2D or perhaps XY Plot, but I'm not entirely sure. I don't often plot data, but this is the way I'm most familiar with.
Please, visit: Admittance Bode for the X log plot.
Observe no bloody units !
- New Posts
- No New Posts