1 Pages (9 items)
LOG based X and Y graphs - How to create Log based XY graphs - Messages
#1 Posted: 1/21/2020 12:27:40 AM
HI Everyone!
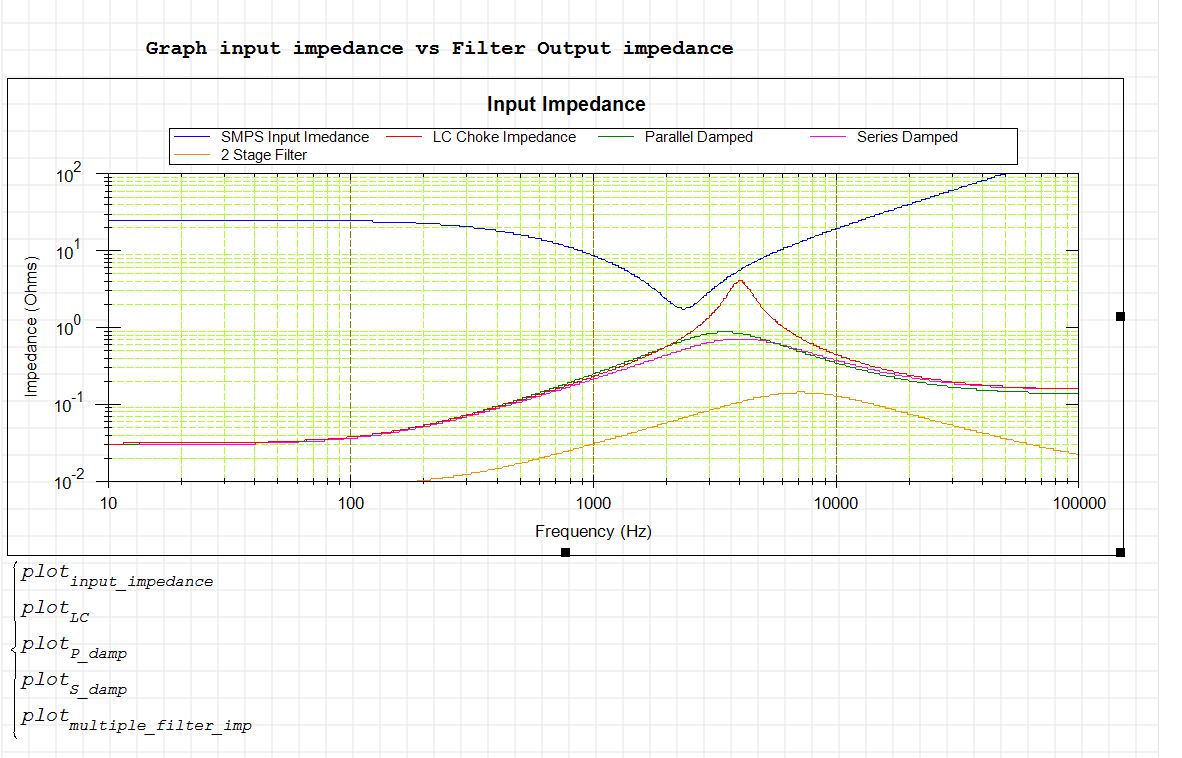
I am attempting to recreate these two graphs seen here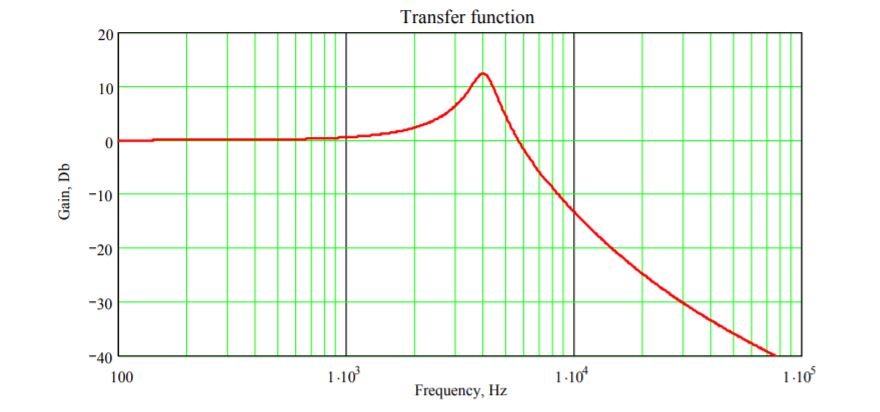
These both come from my source material that may be found here:
Source App Note
Thus far I have followed the app note exactly (to ensure I have something to check against), however I am having difficulty getting my graphs to mirror those of the APP note. Namely my Gain plot seen here: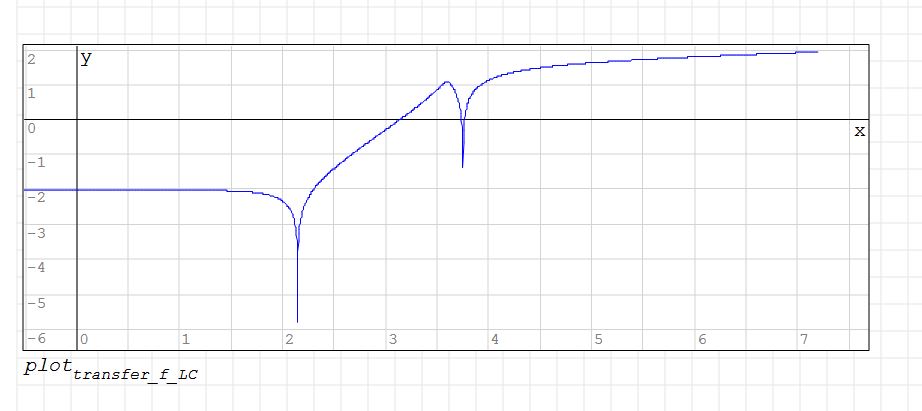
This Gain plot seems to be negated from what I would expect.
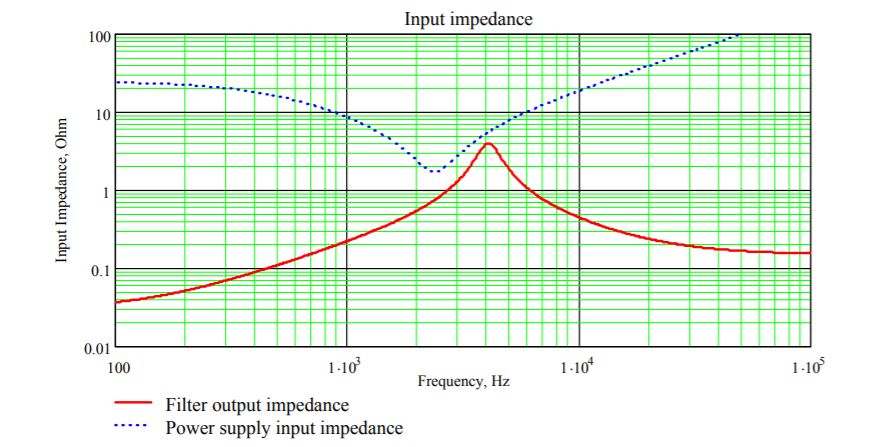
The Impedance Plot seen here:
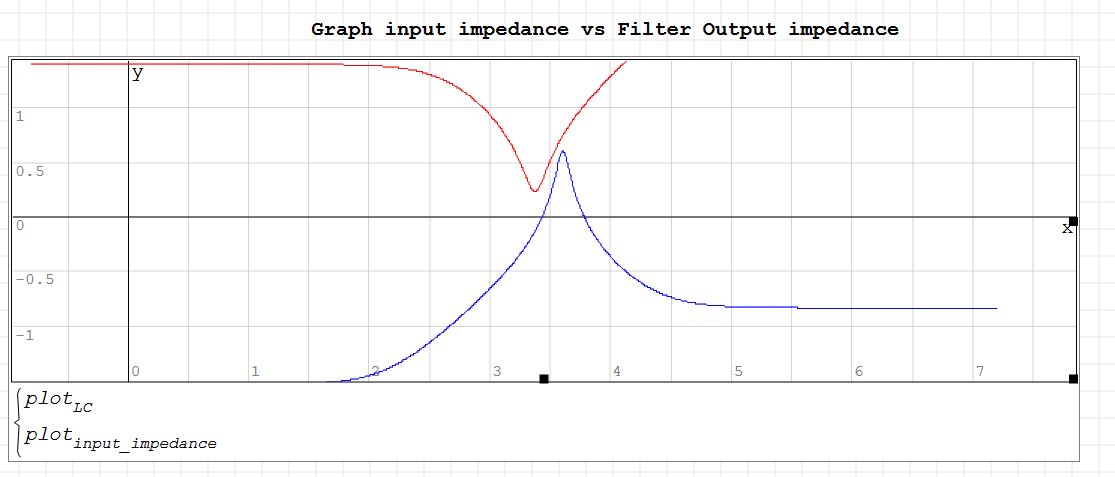
Is right in line with what I would expect however I am unable to figure out how to make the Log ohms Y axis and Log frequency based X axis.
My file may be found here:HELPED_Input_Filter_Test_V1.sm (181.95 KiB) downloaded 1054 time(s).
Thank you all in advance,
Carlo
I am attempting to recreate these two graphs seen here
These both come from my source material that may be found here:
Source App Note
Thus far I have followed the app note exactly (to ensure I have something to check against), however I am having difficulty getting my graphs to mirror those of the APP note. Namely my Gain plot seen here:
This Gain plot seems to be negated from what I would expect.
The Impedance Plot seen here:
Is right in line with what I would expect however I am unable to figure out how to make the Log ohms Y axis and Log frequency based X axis.
My file may be found here:HELPED_Input_Filter_Test_V1.sm (181.95 KiB) downloaded 1054 time(s).
Thank you all in advance,
Carlo
#2 Posted: 1/21/2020 10:31:29 AM
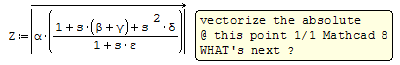
1. The APP notes were done Mathcad 8 or later 2001i, 11
from lazy grid colors [horrible green].
2. First graph as before.
3. Not visible math expressions are for recycle bin.
4. NEVER carry units in maths as they are unit less.
5. Smath is not Mathcad clone.
6. Maybe your construction is not correct wrt APP Notes ???
I didn't check that ...
2DPlots ZedGraph log-log.sm (100.84 KiB) downloaded 1116 time(s).
HELPED_Input_Filter_Test_V1 ... first graph doctored.sm (187.74 KiB) downloaded 1103 time(s).
1 users liked this post
bocatto 2/13/2020 11:27:00 PM
#3 Posted: 1/29/2020 5:14:16 AM
The Maxima plugin provides an interface to Gnuplot. This can be used to come pretty close to Mathcad plots.
You can set the minor grid to gray and remove the dashed line style, to have a more SMath-like appearance.
Note that the Draw2D() command is written in the input placeholder of an image region.
![2020-01-29 09_04_46-SMath Studio 0.99.7251 - [HELPED_Input_Filter_Test_V1_Kr.sm_].png](/en-US/files/Download/4qUmHh/2020-01-29-09_04_46-SMath-Studio-0.99.7251---[HELPED_Input_Filter_Test_V1_Kr.sm_].png)
HELPED_Input_Filter_Test_V1_Kr.sm (353.57 KiB) downloaded 1062 time(s).
You can set the minor grid to gray and remove the dashed line style, to have a more SMath-like appearance.
Note that the Draw2D() command is written in the input placeholder of an image region.
HELPED_Input_Filter_Test_V1_Kr.sm (353.57 KiB) downloaded 1062 time(s).
Technische Mechanik mit SMath Studio: https://link.springer.com/book/10.1007/978-3-658-50592-9
4 users liked this post
NDTM Amarasekera 1/29/2020 6:38:00 AM, Peter J Francis 1/29/2020 9:08:00 AM, frapuano 1/29/2020 5:25:00 AM, bocatto 2/13/2020 11:27:00 PM
#4 Posted: 1/29/2020 1:01:59 PM
WroteHI Everyone!
1. You refer to an application from source and the
first thing you do is freak the variables from source ... Why ?
2. Mathcad 8 was index ... like you try to imitate,
that's retarded because Smath is already in argument style s(j)
The main change from Mathcad 8 => 2001i was the change from
s[i [index style] => argument style s(j)
3. I couldn't make Zgraph work [spooky plugin]
... from there, some Collab might help ?
HELPED_Input_Filter_Test_V1 ... first graph doctored NEW.sm (125.46 KiB) downloaded 1093 time(s).
1 users liked this post
bocatto 2/13/2020 11:27:00 PM
#5 Posted: 1/29/2020 10:35:20 PM
WroteHI Everyone!
...
This Gain plot seems to be negated from what I would expect.
...
Hi Carlo. That's because you take log10 in the y-axis before plotting. I put images in the other post. Check the green lines in Mathcad plots. First plot isn't in log scale in the y-axis.
Best regards.
Alvaro
1 users liked this post
bocatto 2/13/2020 11:27:00 PM
#6 Posted: 1/30/2020 11:05:12 AM
WroteThis Gain plot seems to be negated from what I would expect.
You mean IMPEDANCE plot as per MCD 8
Impedance plot has a part negative from its quadratic.
HELPED_Input_Filter_Test_V1 ... first graph doctored NEW...next.sm (127.12 KiB) downloaded 1069 time(s).
1 users liked this post
bocatto 2/13/2020 11:27:00 PM
#7 Posted: 1/30/2020 12:58:53 PM
... I will leave it there ... which one of the 3 plots.
loglog plot is freaked to me [personal].
HELPED_Input_Filter_Test_V1 ... first graph doctored NEW...next.sm (132.32 KiB) downloaded 1135 time(s).
loglog plot is freaked to me [personal].
HELPED_Input_Filter_Test_V1 ... first graph doctored NEW...next.sm (132.32 KiB) downloaded 1135 time(s).
1 users liked this post
bocatto 2/13/2020 11:27:00 PM
#8 Posted: 2/13/2020 11:36:00 PM
Well Guys after ALOT of struggling with Maxima (Which for whatever reason isnt working for me) I finally got ZEDgraph to work for me!
The Finished Document may be found here:SMPS_Input_Filter_Design_TI_APP_Note.sm (555.35 KiB) downloaded 1423 time(s).
And I was finally able to recreate the graphs!

[albumimg]1606[/albumimg]
Again this is pretty much a direct recreation of the TI App note, but it served for a great learning experience!
I will be sure to PROPERLY post it under the samples area along with the app note
Thank you guys again!!! (Especially Jean/Razonar)
The Finished Document may be found here:SMPS_Input_Filter_Design_TI_APP_Note.sm (555.35 KiB) downloaded 1423 time(s).
And I was finally able to recreate the graphs!
[albumimg]1606[/albumimg]
Again this is pretty much a direct recreation of the TI App note, but it served for a great learning experience!
I will be sure to PROPERLY post it under the samples area along with the app note
Thank you guys again!!! (Especially Jean/Razonar)
#9 Posted: 2/13/2020 11:38:17 PM
Wrote... I will leave it there ... which one of the 3 plots.
loglog plot is freaked to me [personal].
HELPED_Input_Filter_Test_V1 ... first graph doctored NEW...next.sm (132.32 KiB) downloaded 1135 time(s).
Well it turns out that I was taking a doulbe LOG of the graph! Silly Me!
1 Pages (9 items)
- New Posts
- No New Posts