1 Pages (5 items)
2D plot, parametric functions - Combined with sys() matrices - Messages
#1 Posted: 10/11/2023 9:51:06 PM
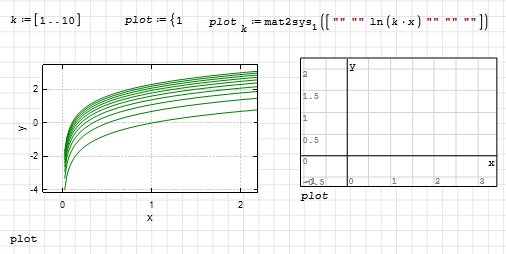
When a parametric function is stacked with sys() nested matrix or matrices, it doesn't plot.
It is plotting if they are at same level in sys(), plot1 example.
When there is no parametric function, there is no problem, plot3 example.
Otherwise 2D plot is not capable to execute.
XY-Plot has no issues at all.
Regards
plotbug.sm (23.75 KiB) downloaded 1467 time(s).


It is plotting if they are at same level in sys(), plot1 example.
When there is no parametric function, there is no problem, plot3 example.
Otherwise 2D plot is not capable to execute.
XY-Plot has no issues at all.
Regards
plotbug.sm (23.75 KiB) downloaded 1467 time(s).
1 users liked this post
Oscar Campo 10/11/2023 10:28:00 PM
#2 Posted: 10/14/2023 9:28:44 PM
Once in general the plot regions (built-in, X-Y Plot) can handle nested lists, it is fair to call the failure to do so in special cases a bug
Technische Mechanik mit SMath Studio: https://link.springer.com/book/10.1007/978-3-658-50592-9
#3 Posted: 10/15/2023 2:04:12 AM
#4 Posted: 10/17/2023 2:46:49 PM
Another example where the bug described by overlord makes things more complicated as the SMath plot cannot handle nested lists
Best regards.
Alvaro.
Best regards.
Alvaro.
#5 Posted: 10/17/2023 3:14:22 PM

Parsing the input data is a rather difficult part of such components. A dedicated designer is needed to cover commonly used use cases while avoiding ambiguity.
Some of the examples shown here were not originally intended to be used, but are artifacts of a particular implementation. Increasing complexity of input variants requires careful testing of compatibility with old behavior. This is especially true for nested structures.
For X-Y Plot component, I chose some use cases that I indicated in the first post and, when updating, I constantly checked that the specified examples worked correctly.
Russia ☭ forever, Viacheslav N. Mezentsev
2 users liked this post
1 Pages (5 items)
- New Posts
- No New Posts