Plotting with 2D plot - 2D Plot region not working? - Messages
 I can't get this to work properly. I have tested with just a simple function using x as variable, and it works. This will not!
WroteI can't get this to work properly. I have tested with just a simple function using x as variable, and it works. This will not!
You are trying to plot with units.
I don't think it is possible or maybe I am wrong.
I could plot without units by the way.
Regards
WroteI can't get this to work properly. I have tested with just a simple function using x as variable, and it works. This will not!
From the function you are trying to evaluate wrt scalar 'x',
give yourself two values of 'x', and their corresponding 'y' values
Then f(x):=linterp(X.Y,x) and plot f(x). linterp(,,,) ignores units
thus you have a clean plot free of units gyzmas.
Cheers ... Jean
WroteWroteI can't get this to work properly. I have tested with just a simple function using x as variable, and it works. This will not!
From the function you are trying to evaluate wrt scalar 'x',
give yourself two values of 'x', and their corresponding 'y' values
Then f(x):=linterp(X.Y,x) and plot f(x). linterp(,,,) ignores units
thus you have a clean plot free of units gyzmas.
Cheers ... Jean
Thanks, Jean.
Can you show me an example?
Best Regards, Tommy
WroteCan you show me an example?
... like this done 4 days ago.
In this one linterp(,,,) was just enough.
Eventually, you may have to collect more points for cinterp(,,,)
But check if cinterp(,,,) sterilizes units like linterp(,,,) ???
With cinterp(,,,) the "freak" factor may be more savant !
Does it work for your project ?
Cheers ... Jean
Integral (1) DoctoredRed (1).sm (37.69 KiB) downloaded 1403 time(s).
WroteIt seems Smath can do plotting with units, just not my function from above
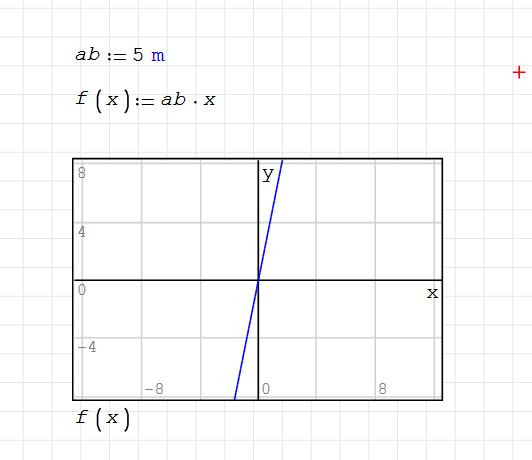
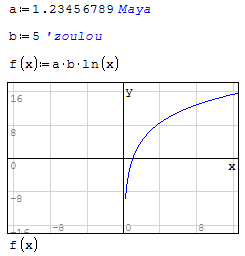
zoulou & Maya are pure decoration. Your unit system is not.
Wrote
zoulou & Maya are pure decoration. Your unit system is not.
I'm not quite sure I get that...
WroteIt seems Smath can do plotting with units, just not my function from above. However, I am missing functionality on the 2D plot settings, adjusting the x-axis, y-axis etc.
For the QuickPlot @ X, Y are adjusted by mouse wheel.
Shift+mouse wheel => X
Cntrl+mouse wheel => Y
Wrote
zoulou & Maya are pure decoration. Your unit system is not.
Can you tell me exactly what you mean by this? I have tried plotting with m (meters) inside the function, but in my original function, it is not possible to plot with units...
Regards
Tommy
WroteI have tried plotting with m (meters) inside the function, but in my original function, it is not possible to plot with units...
Is that what you mean: plot with units labels ?
Wrote
Is that what you mean: plot with units labels ?
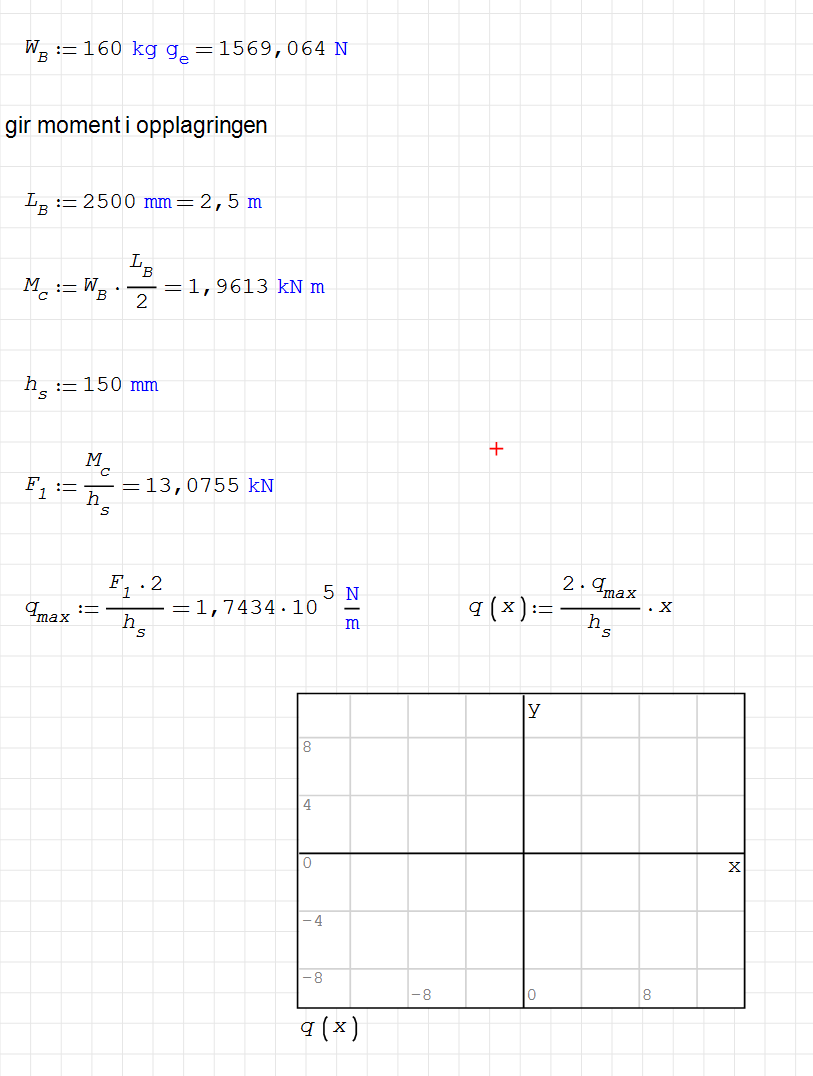
I am simply trying to plot the function with N/m as unit, since I was able to plot with m as unit, I don't understand what the issue is.
Nice formatting by the way...
WroteI am simply trying to plot the function with N/m as unit, since I was able to plot with m as unit, I don't understand what the issue is.
Curiosity or bug ... Units adepts, can you doctor that one ?
WroteWroteI am simply trying to plot the function with N/m as unit, since I was able to plot with m as unit, I don't understand what the issue is.
Curiosity or bug ... Units adepts, can you doctor that one ?
Overlord has already published the correct answer about how to proceed to graph with units, but unfortunately I think that the user did not notice and was distracted by the other posts about ... I don't know about what they are.
Best regards.
Alvaro.
Wrote
Overlord has already published the correct answer about how to proceed to graph with units, but unfortunately I think that the user did not notice and was distracted by the other posts about ... I don't know about what they are.
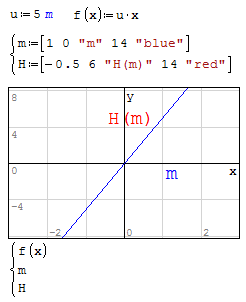
Yes, first reply by Overlord has the answer

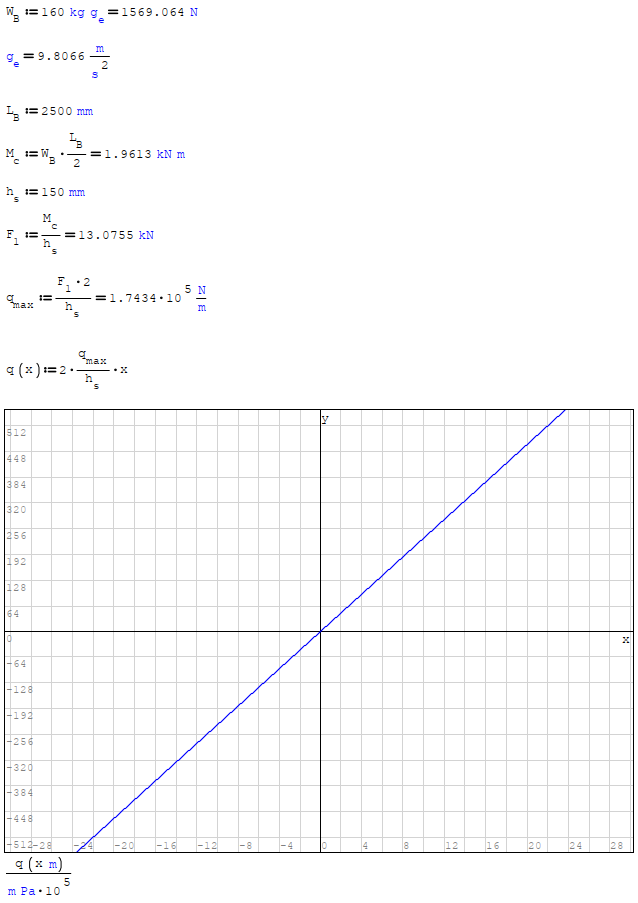
From a general point of view, you can plot functions with units:
- by restoring "x" units in the input of the graph, since X-Y plot is going to place unitless scalars where "x" is.
If your function expected an input with units, and since X-Y plot will feed that input without units, that's why you need to multiply "x" with that proper unit. - by dividing the complete function with the expected output unit of measure, since X-Y plot will only accept values without units on y-axis, while the original function to be plotted is going to generate results with units.
At least, that's how I depicted it in my mind to remember what to do.
Consistent units with different magnitude will consistently scale your "x" and "y" axis.
WroteConsistent units with different magnitude will consistently scale your "x" and "y" axis
... while observing the SI conversion kJ/mol =>J/mol.
Adapt the remaining of the project to suit: tabulate/plot.
Integral 0000000 Transit-Units.sm (22.86 KiB) downloaded 1347 time(s).
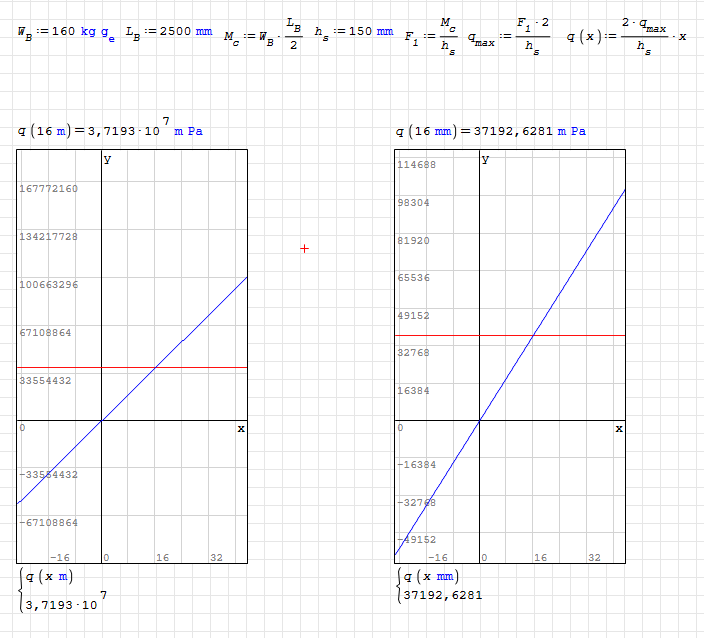
SMath is often able to plot with units, but you have to tell SMath the unit you are plotting along the x-axis (mm vs. cm vs. m), and you have to understand SMath plots the values along the y-axis in the SI units (that's the only way it knows how to).
In your case, you have to zoom far out on the y-axis to see the results.
What I usually do is what overlord did, dividing the function (within 2D plot) by the desired unit to force the results I want.
Best regards,
2D plot with units.sm (7.43 KiB) downloaded 1388 time(s).
- New Posts
- No New Posts