1 Pages (5 items)
Why smath cannot plot this equation? - Messages
#1 Posted: 12/23/2024 12:57:25 AM
Hi,
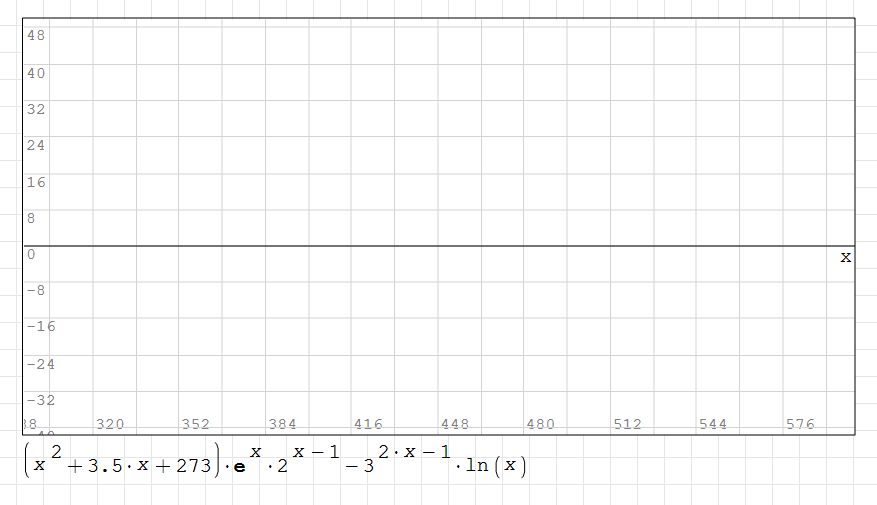
Why smath cannot plot this?
Smath
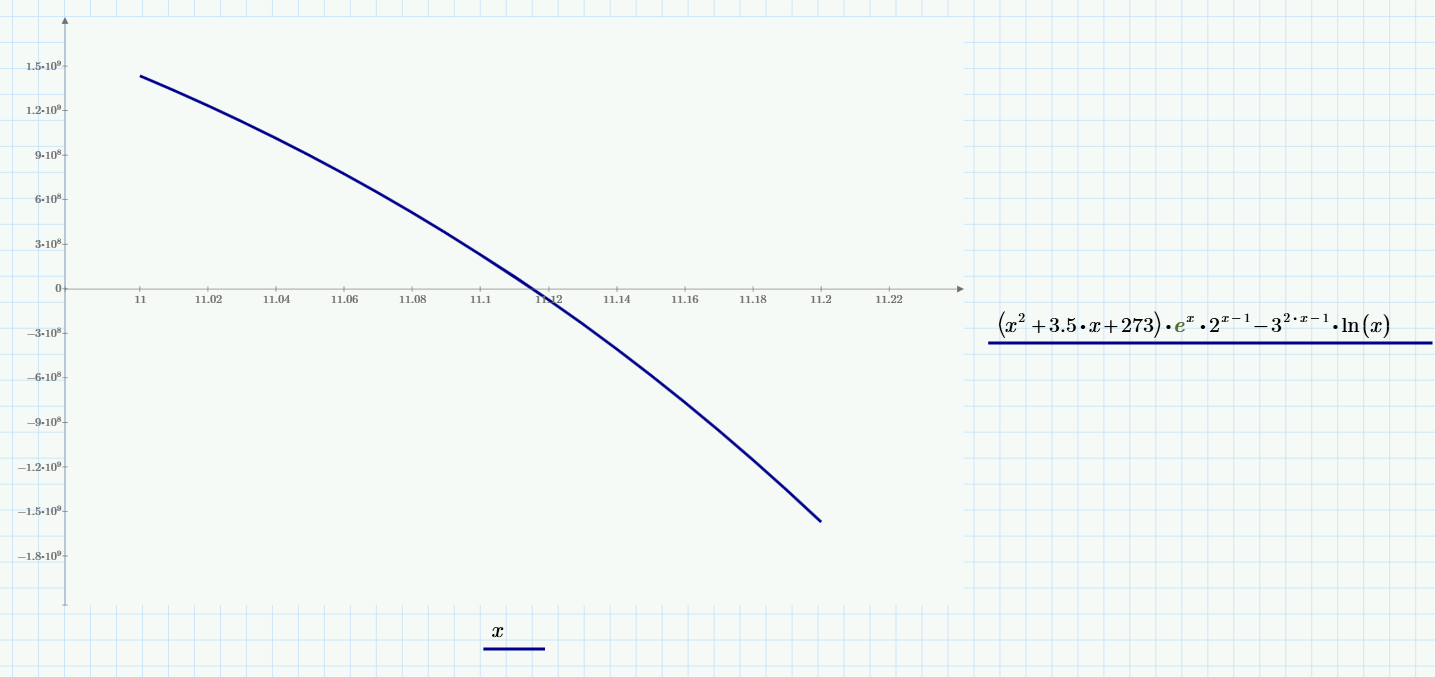
Mathcad
Why smath cannot plot this?
Smath
Mathcad
#2 Posted: 12/23/2024 3:50:33 PM

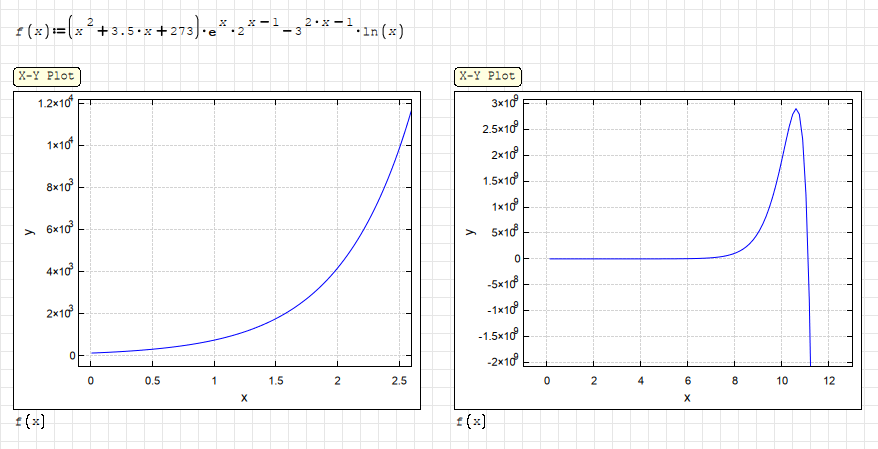
For me it plots like in wolfram. There might be some hidden brackets?
(your viewport is out of the plot area, so it doesn't show anything)
edit: added both small and large plot ranges
f(2).sm (36.41 KiB) downloaded 1290 time(s).
![2024-12-23 13_54_21-SMath Solver - [f(2).sm].png](/en-US/files/Download/Lubrnz/2024-12-23-13_54_21-SMath-Solver---[f(2).sm].png)
(your viewport is out of the plot area, so it doesn't show anything)
edit: added both small and large plot ranges
f(2).sm (36.41 KiB) downloaded 1290 time(s).
If you like my plugins please consider to support the program buying a license; for personal contributions to me: paypal.me/dcprojects
1 users liked this post
sergio 12/23/2024 9:37:00 PM
#3 Posted: 12/23/2024 10:17:55 PM
Davide, ok, I see. Thank you.
Smath plot seems to be primitive. I don't like the way the Smath plots are built and the primitive settings they have.
Even if the poor plots in Mathcad prime has its shortcomings they seems to be better than in Smath...
It would be good if it could be implemented in Smath the Mathcad Prime plot.
Smath plot seems to be primitive. I don't like the way the Smath plots are built and the primitive settings they have.
Even if the poor plots in Mathcad prime has its shortcomings they seems to be better than in Smath...
It would be good if it could be implemented in Smath the Mathcad Prime plot.
#4 Posted: 12/24/2024 12:22:55 AM
I agree. The integrated plots were primarly intended to be fast sketch plots, hence the poor features. We can hope in future they will be improved.
As for now, for advanced plots, I reccomend the XY plot plugin made by uni.
As for now, for advanced plots, I reccomend the XY plot plugin made by uni.
If you like my plugins please consider to support the program buying a license; for personal contributions to me: paypal.me/dcprojects
1 users liked this post
overlord 12/24/2024 12:30:00 AM
1 Pages (5 items)
- New Posts
- No New Posts