1 Pages (10 items)
How to force SMath to show values in decimal format and not fraction - Decimal, fraction format - Messages
#1 Posted: 10/10/2017 3:55:09 PM
Hi,
I am trying to display output calculations visually on a diagram in SMath through text. whenever there is decimal/fraction it always displays it in fraction format and I want to display it in decimal.
how can I do this please knowing that I already tried forcing the "fraction" option in the Tools to "Decimal"?
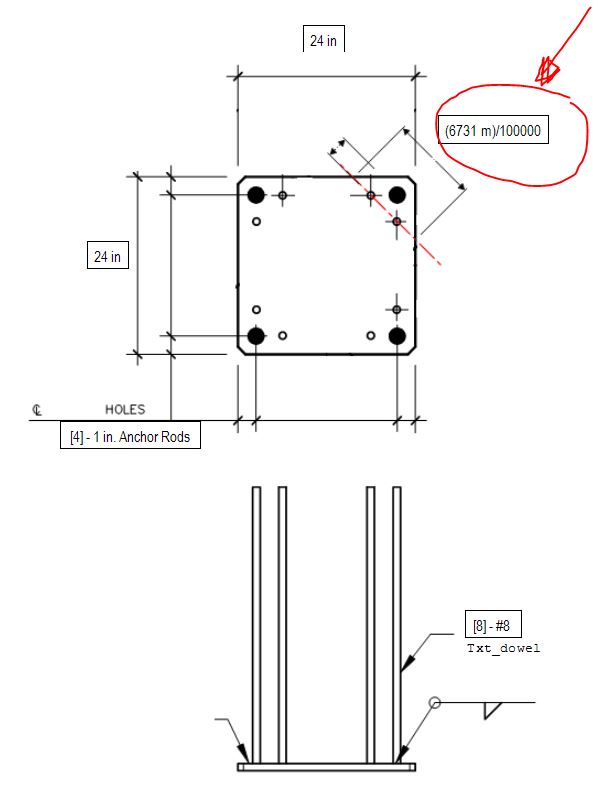
Thanks in advance!
I am trying to display output calculations visually on a diagram in SMath through text. whenever there is decimal/fraction it always displays it in fraction format and I want to display it in decimal.
how can I do this please knowing that I already tried forcing the "fraction" option in the Tools to "Decimal"?
Thanks in advance!
#2 Posted: 10/10/2017 4:39:10 PM
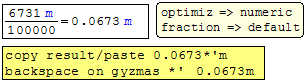
Maybe like this ?
#3 Posted: 10/10/2017 6:18:12 PM
Thanks Jean, but I did not understand how you made it work.
Can you send a small example?
Also, I did not find any "optimiz" option in my version of SMath.
example.sm (1.99 KiB) downloaded 1094 time(s).
thanks
Can you send a small example?
Also, I did not find any "optimiz" option in my version of SMath.
example.sm (1.99 KiB) downloaded 1094 time(s).
thanks
#4 Posted: 10/10/2017 7:14:12 PM
Hello Alberta ! I consulted for Syncrude [6 months 1983].
I can't reproduce your "Combo box" 6179.
example.sm (3.93 KiB) downloaded 1076 time(s).
I can't reproduce your "Combo box" 6179.
example.sm (3.93 KiB) downloaded 1076 time(s).
#5 Posted: 10/10/2017 8:22:29 PM

If you are using the conditionally formatted label or a plot, it is possible to use var2str() from CustomFunctions plugin.
Otherwise you can simply use a math region, right click on it and uncheck "Display input data", add a border (if you want), and that's all (in this case, use the options that Jean has mentioned in his first reply)
example.sm (8.79 KiB) downloaded 1080 time(s).
Otherwise you can simply use a math region, right click on it and uncheck "Display input data", add a border (if you want), and that's all (in this case, use the options that Jean has mentioned in his first reply)
example.sm (8.79 KiB) downloaded 1080 time(s).
If you like my plugins please consider to support the program buying a license; for personal contributions to me: paypal.me/dcprojects
1 users liked this post
Mo 10/11/2017 1:21:00 AM
#6 Posted: 10/10/2017 11:35:16 PM
WroteCan you send a small example?
Once the document is ready for publishing => two options,
1. in customized text region [mostly for results]
2. in "Formatted Label" [very convenient to show all maths]
Image Formated LABEL [Oxyhemoglobin].sm (17.17 KiB) downloaded 936 time(s).
Image Formated LABEL.sm (24.5 KiB) downloaded 1044 time(s).
1 users liked this post
Mo 10/11/2017 1:21:00 AM
#7 Posted: 10/11/2017 12:04:36 AM
... Oxyhemoglobin ... you can reworks the maths by just clicking on
the region of interest. Try changing 'b' limit of the integrator,
all the slided regions disappear [similar to Mathcad "bring to front"],
as you quit the "Formated Label" region, everything comes back live.
Mathcad could not do that, the graph would have to be external.
The all stuff "Formated Label" is calculated first and the graph
behaves like if it would be below in normal work sheet.
Fantastic for day to day classroom in small chunks or for client.
Cheers, Jean
#8 Posted: 10/11/2017 1:23:02 AM
Thanks a lot Jean, Thanks a lot Davide.
Jean, I think the Oxyhemoglobin was a post for someone else because it is not related to the topic
Jean, I think the Oxyhemoglobin was a post for someone else because it is not related to the topic
#9 Posted: 10/11/2017 10:06:21 AM
WroteJean, I think the Oxyhemoglobin was a post for someone else because it is not related to the topic
"Someone else" is myself. It shows how to publish a final project.
Oxyhemoglobin dates back to Mathcad Collaboratory. From recollection,
it was quite a brain storm because the published data were not as collected.
Rather, the data set was freaked by unknown. That does not help modeling !
On the other hand, the original 244 pairs does not help the fit,
16 pairs were largely enough.
Cheers, Jean
Genfit Oxyhemoglobin Reconciliation.sm (47.68 KiB) downloaded 1018 time(s).
Image Formated LABEL [Oxyhemoglobin].sm (17.3 KiB) downloaded 868 time(s).
Genfit Oxyhemoglobin.sm (54.82 KiB) downloaded 1103 time(s).
#10 Posted: 10/11/2017 1:03:00 PM
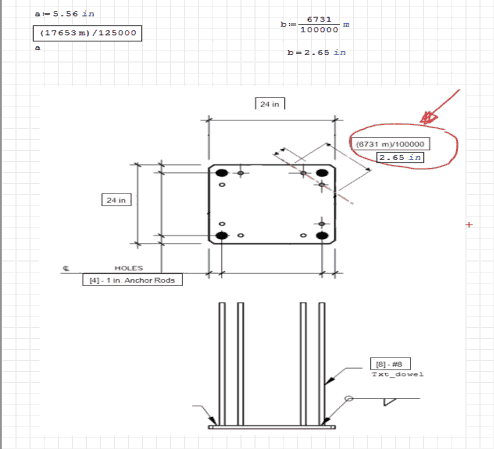
I think is better to use the result directly in the drawing by changing the units and hiding the name of the variable
example_IMD.sm (546.71 KiB) downloaded 1088 time(s).
example_IMD.sm (546.71 KiB) downloaded 1088 time(s).
1 Pages (10 items)
- New Posts
- No New Posts