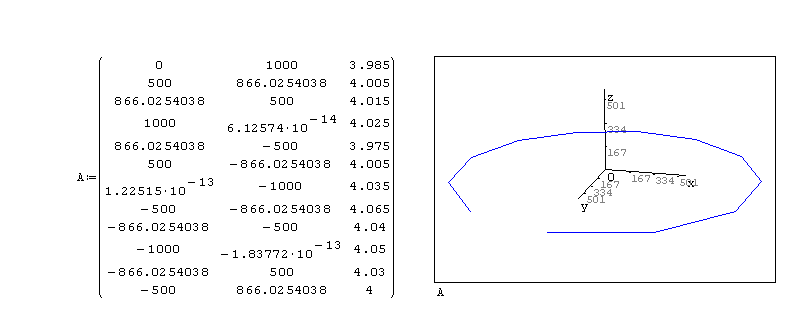
hi,
i ve here some point in x,y and z
eg:
X Y Z
0 1000 3,985
500 866,0254038 4,005
866,0254038 500 4,015
1000 6,12574E-14 4,025
866,0254038 -500 3,975
500 -866,0254038 4,005
1,22515E-13 -1000 4,035
-500 -866,0254038 4,065
-866,0254038 -500 4,04
-1000 -1,83772E-13 4,05
-866,0254038 500 4,03
-500 866,0254038 4
how can i "draw" this in a 3D diagramm (as points with a spline as connecting line between the points)
perhaps like this here
http://img697.imageshack.us/i/spirale1.png/