1 Pages (10 items)
Ploting Function - Messages
#1 Posted: 6/27/2011 3:06:01 PM
Hello,
at first a great acclamation for this Tool.
I'm using it in my Bachelor-Thesis and it is very helpfull.
At this point is will Draw a Plot of Current-Flow in Electrical Circuit.
For this i have a equation, but this will not be shown in the Plot-Windows.

PS: Is there still a developement in progress for SMath???
at first a great acclamation for this Tool.
I'm using it in my Bachelor-Thesis and it is very helpfull.
At this point is will Draw a Plot of Current-Flow in Electrical Circuit.
For this i have a equation, but this will not be shown in the Plot-Windows.
PS: Is there still a developement in progress for SMath???
#2 Posted: 6/27/2011 3:50:20 PM

Hello,
I do not know if I understood you well, but the plot could not be drawn because of the wrong units.
Here is a possible solution:

As far as I know, Andrey is working on a new SMath version at the moment.
Regards,
Radovan
I do not know if I understood you well, but the plot could not be drawn because of the wrong units.
Here is a possible solution:
WrotePS: Is there still a developement in progress for SMath???
As far as I know, Andrey is working on a new SMath version at the moment.
Regards,
Radovan
When Sisyphus climbed to the top of a hill, they said: "Wrong boulder!"
#3 Posted: 6/27/2011 4:23:28 PM
If i'm seeing it right you have inserted the Unit in the Plot.
When i trie to do this over the Ctrl+W Hotkey, SMath inserts "'s" and don't recognize it as Unit.
Then in the Argument is displayed "x's"
When i trie to do this over the Ctrl+W Hotkey, SMath inserts "'s" and don't recognize it as Unit.
Then in the Argument is displayed "x's"
#4 Posted: 6/27/2011 4:44:45 PM
Hello,
My advice is to use multiplication between variable and unit.
1. this is not advisable
x[CTRL+W] ... and choosing Second('s) from the dialog box - it will produce "x's"
2. this shoud work
x*[CTRL+W] ...and choosing Second('s) from the dialog box
...or simply pressing
x*'s
(apostrophe ' will give you black circle as the placeholder - for inserting units - instead a regular black square)
BTW, Hotkey [CTRL + SPACE] will give you the Dynamic assistance - but it will not work in the 2D or 3D plot forms.
I hope this helped.
Regards,
Radovan
WroteIf i'm seeing it right you have inserted the Unit in the Plot.
When i trie to do this over the Ctrl+W Hotkey, SMath inserts "'s" and don't recognize it as Unit.
Then in the Argument is displayed "x's"
My advice is to use multiplication between variable and unit.
1. this is not advisable
x[CTRL+W] ... and choosing Second('s) from the dialog box - it will produce "x's"
2. this shoud work
x*[CTRL+W] ...and choosing Second('s) from the dialog box
...or simply pressing
x*'s
(apostrophe ' will give you black circle as the placeholder - for inserting units - instead a regular black square)
BTW, Hotkey [CTRL + SPACE] will give you the Dynamic assistance - but it will not work in the 2D or 3D plot forms.
I hope this helped.
Regards,
Radovan
When Sisyphus climbed to the top of a hill, they said: "Wrong boulder!"
#5 Posted: 6/28/2011 2:07:36 AM
This was it!
Thank you very much!
Thank you very much!
#6 Posted: 6/28/2011 2:21:32 PM
Here i'm again.
Next Step and next Problem.
The Plot is only valid for the first Swing over Zero till first pass through zero.
So i tried to modify the definition of equation with the if and else function.
But sometimes SMath crashes and sometimes SMath still says no definition.
Also the solve function doesn't work at first try. SMath told that it was tried to divide by zero.
Someone one more hint for the right result???
#7 Posted: 6/28/2011 5:16:00 PM
Hello,
Again, I am not quite sure what did you want to do, sorry.
Nevertheless, I will try to give you an answer. If this does not solve your problem, just be more specific please.
Here it is:
Btw, it is advisable to avoid "x" as a function argument in the function definition (I used "X" here) when you try to make plots ("x" is reserved for 2D plots and "x","y" for 3D plots. For instance, this will not work. In some cases this will work, but for this particular one it does not (Do not know why).
Regards,
Radovan
When Sisyphus climbed to the top of a hill, they said: "Wrong boulder!"
#8 Posted: 6/29/2011 3:36:51 AM
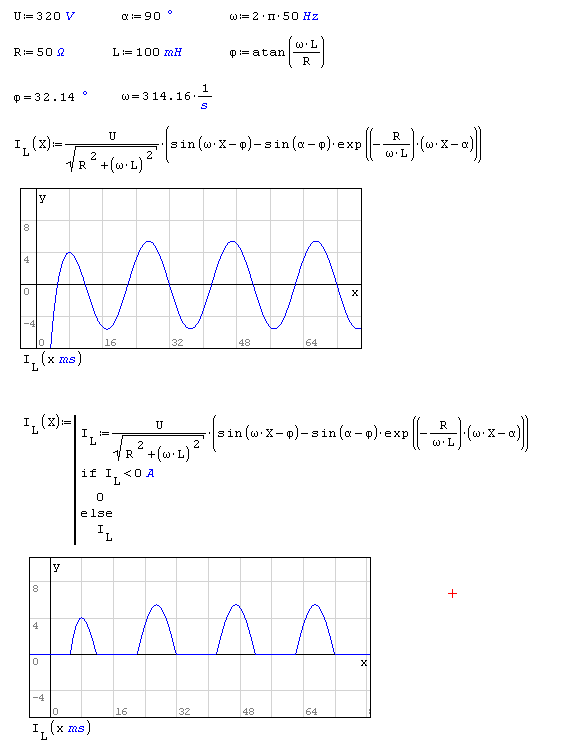
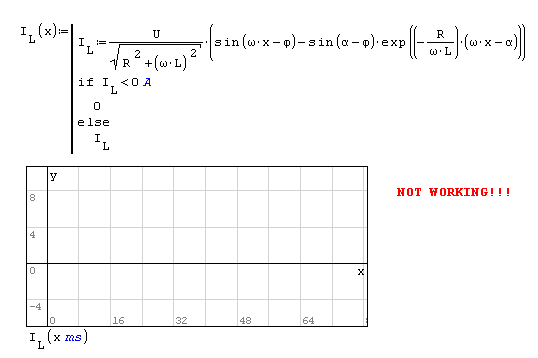
At first i will try to specific more the behavior i need.
The Equation for IL let you calculate how current flows in a controlled transformer rectifier circuit with center tap.
But it is only valid for the period interval (in this case from 0 to 20ms because of the 50Hz Sinus). Then the fist Swing
you see in the Plot will be periodical repeated, if alpha doesn't change.
Alpha is the point were the Switch is turned on.
Because it is a two pulsed rectifier in the next step i will need to add the swing for alpha+pi/2, but i have at this time
enough problems with the first swing
As you see below, i have copied your resolution but it doesn't work at all.
No error message is given from SMath.
I'm yousing the stable release, should i switch to the actual beta?
#9 Posted: 6/29/2011 5:01:42 AM
Hello,
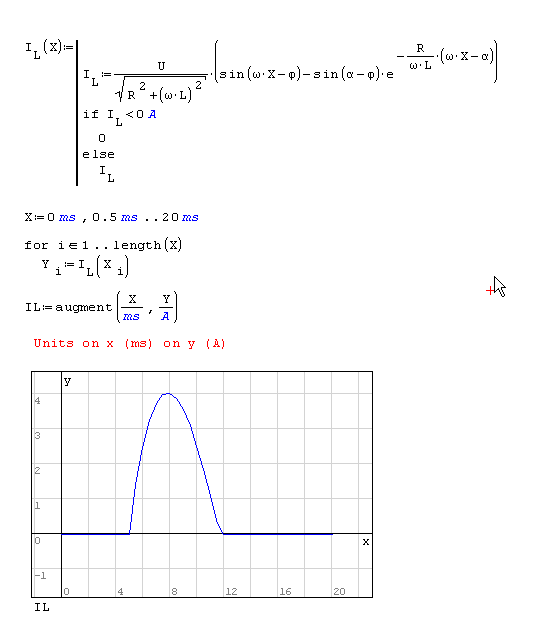
I think you should, there are some fixes in the recent beta.
Btw, you can make a plot this way (plotting a matrix with two columns)
Regards,
Radovan
WroteI'm yousing the stable release, should i switch to the actual beta?
I think you should, there are some fixes in the recent beta.
Btw, you can make a plot this way (plotting a matrix with two columns)
Regards,
Radovan
When Sisyphus climbed to the top of a hill, they said: "Wrong boulder!"
1 Pages (10 items)
- New Posts
- No New Posts