1 Pages (8 items)
Problem Plotting Functions - Cannot plot function - Messages
#1 Posted: 7/8/2023 2:43:26 AM

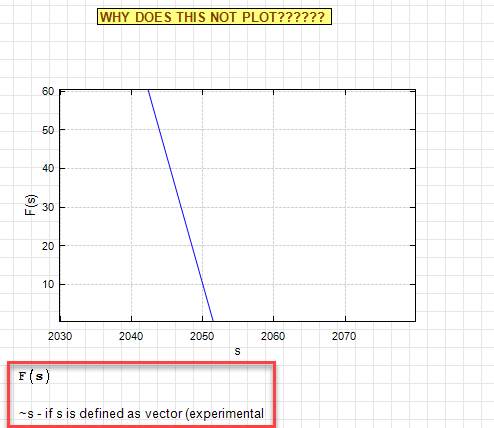
My Mathcad brain causes me to misunderstand some SMATH syntax. The is especially true in XY-Plots. I have created two function: F(s) and F1(s), which is discontinuous. If I redefine the functions as vectors and use augment to define the x-axis, the plots look okay. However, when I try to plot just the function, it does not work. These plots do not create a trace list as with the vector versions. F(s) just doesn’t plot. F1(s) also doesn’t plot, plus it gives an error.
In short, how do I plot simple functions?
Any help is appreciate, as always.
Plot Functions Question.sm (12.6 KiB) downloaded 1138 time(s).
In short, how do I plot simple functions?
Any help is appreciate, as always.
Plot Functions Question.sm (12.6 KiB) downloaded 1138 time(s).
Reg CurryLoveland, CO
#2 Posted: 7/8/2023 3:33:26 AM
Hi JReg. If I'm not wrong, just try to plot both with an undefined variable like F(so) and F1(so). The problem is that 's' is a vector.
Best regards.
Best regards.
#3 Posted: 7/8/2023 7:28:35 AM
Razonar,
Thanks much. That works.
Hope you don't mind if I have a second question.
In this attached sm file, I calculate the solution to an ODE with those two driving functions. Note the last integral in the solution. If I use F(s) it works; however, F1(s) is the function I want in the integral. For some reason it does not work. You will have to change F to F1 in that last integral to see that it fails.
Have I missed something obvious?
Thanks again.EMISSION REDUCTION Test.sm (28.71 KiB) downloaded 1195 time(s).
Reg CurryLoveland, CO
#4 Posted: 7/8/2023 10:39:50 AM
It works if you define F1 as: F1(z):=(M*(z-tstart)+Fexp(tstart))*(z≤tfinish)+Fexp(tfix)*(z>tfinish)
i.e. using Boolean values: (z≤tfinish) = 1 if true, 0 if false, etc.
Don't know why SMath has a problem integrating if.. else.. structures.
i.e. using Boolean values: (z≤tfinish) = 1 if true, 0 if false, etc.
Don't know why SMath has a problem integrating if.. else.. structures.
#5 Posted: 7/8/2023 1:45:07 PM
Thanks. I’ll give that a try.
Reg CurryLoveland, CO
#6 Posted: 7/8/2023 3:56:23 PM
WroteIt works if you define F1 as: F1(z):=(M*(z-tstart)+Fexp(tstart))*(z≤tfinish)+Fexp(tfix)*(z>tfinish)
i.e. using Boolean values: (z≤tfinish) = 1 if true, 0 if false, etc.
Don't know why SMath has a problem integrating if.. else.. structures.
Thanks again. That really helped.
Reg CurryLoveland, CO
#7 Posted: 7/9/2023 7:45:20 AM
WroteDon't know why SMath has a problem integrating if.. else.. structures.
Smath integrates if/otherwise discontinuous functions.
Bolean must be specified completely, if NOT navigates.
Integrate Discontinuous.sm (36.51 KiB) downloaded 1184 time(s).
#8 Posted: 7/10/2023 4:22:25 AM

Due to the implementation features, you can't use the function argument the same way you do it in Mathcad. The component allows you to use a vector variable if you add a tilde before the name.
Plot Functions Question (uni).sm (14.92 KiB) downloaded 1160 time(s).
Plot Functions Question (uni).sm (14.92 KiB) downloaded 1160 time(s).
Russia ☭ forever, Viacheslav N. Mezentsev
1 Pages (8 items)
- New Posts
- No New Posts