1 Pages (10 items)
create a function from values - i have a table of values with the corresponding time and need a function i can differentiate - Messages
#1 Posted: 11/27/2019 6:04:57 PM
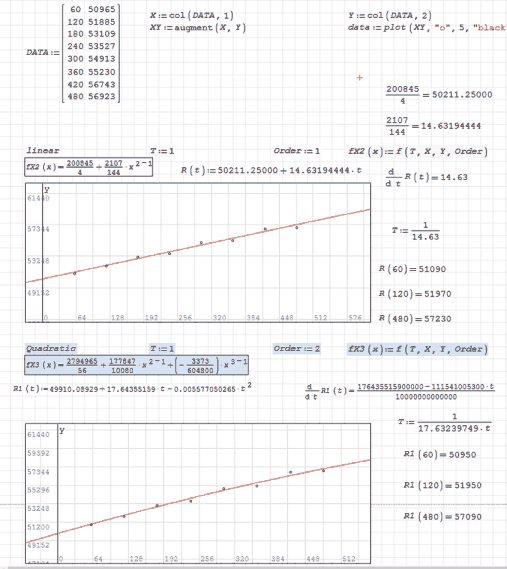
hi i have a table of values [R(t=60)=50965] with no obvious pattern and i need to create a function to fit into the formula
1/T = d (ln(R(t)) / dt
my thought was to make S(t)=ln(R(t)) and do d(S(t))/dt but i dont know how to turn a bunch of values into a function in smath and excel doesnt understand the function properly (i left out the last value and did auto complete and it was too far off)

R(t) is in counts per second
and i am solving for T
1/T = d (ln(R(t)) / dt
my thought was to make S(t)=ln(R(t)) and do d(S(t))/dt but i dont know how to turn a bunch of values into a function in smath and excel doesnt understand the function properly (i left out the last value and did auto complete and it was too far off)
R(t) is in counts per second
and i am solving for T
#2 Posted: 11/27/2019 6:30:00 PM
WroteWrotehi i have a table of values [R(t=60)=50965] with no obvious pattern and i need to create a function to fit into the formula
1/T = d (ln(R(t)) / dt
Start by creating the Smath data table, attach in the Forum.
Your wording looks very alike fitting the laser project.
Toke > 1 month to do in Mathcad as it was so unusual.
But we had lot more data points.
Jean
HW8Q1.sm (2.45 KiB) downloaded 940 time(s).
do you mean like a matrix?
#3 Posted: 11/27/2019 7:01:34 PM
WroteStart by creating the Smath data table,
Before going ahead, the wiggling around the straight fit,
is it real or digitizing noise from equipment ?

#5 Posted: 11/27/2019 7:08:35 PM
WroteWroteStart by creating the Smath data table,
Before going ahead, the wiggling around the straight fit,
is it real or digitizing noise from equipment ?
i would be comfortable assuming it is based on the contextFile not found.File not found.
#6 Posted: 11/27/2019 9:14:47 PM
#7 Posted: 11/27/2019 10:14:46 PM
thank you so much
as much as i would like to say part b of the question i need to do my own homework i just couldnt understand how to get the equation of that line
thanks again
as much as i would like to say part b of the question i need to do my own homework i just couldnt understand how to get the equation of that line
thanks again
#8 Posted: 11/28/2019 12:03:25 AM
Wrotethank you so much
as much as I would like to say part b of the question I need to do my own homework I just couldn't understand how to get the equation of that line
1. You mean equation of the straight red line of the first plot ?
2. Or: the piece wise linterp between the support points ?
linterp, cinterp, ainterp are built-in Smath from f(x) menu.
The straight line in [1] can be manipulated a bit from statistical methods [Not Smath built-in].
Also, if you don't like the rough bifurcation at the supports
points, easy to fillet for smooth path.
No more need for the first replies before the last attachment,
then will be removed.
Cheers ... Jean
#9 Posted: 11/28/2019 1:35:47 AM
I think you can also use the least-squares method to find the equation that best fits your data.
Ajust_by_Last_Square_Selection_Engineering_studente.sm (62.08 KiB) downloaded 1004 time(s).
Best Regards
Carlos
Ajust_by_Last_Square_Selection_Engineering_studente.sm (62.08 KiB) downloaded 1004 time(s).
Best Regards
Carlos
1 users liked this post
sergio 11/28/2019 6:00:00 AM
#10 Posted: 11/28/2019 8:55:51 AM
Here is Cholesky [Least Squares], otherwise.
Ge sensor [Germanium] is an exceptional application.
Jean

Genfit 0 Ge SubCryogenic.sm (39.2 KiB) downloaded 893 time(s).
Data.sm (54.7 KiB) downloaded 955 time(s).
Ge sensor [Germanium] is an exceptional application.
Jean
Genfit 0 Ge SubCryogenic.sm (39.2 KiB) downloaded 893 time(s).
Data.sm (54.7 KiB) downloaded 955 time(s).
1 Pages (10 items)
- New Posts
- No New Posts