Slow plot - Messages
Is it possible to speed up the plot on this sheet? I cant understand why it is so slow..
Best regards,
slow plot.sm (298 KiB) downloaded 1037 time(s).

Unrelated but I notice an exception if I try to write something on the canvas of the file above:
System.IO.FileNotFoundException: file 'ZedGraphRegion.resources' not found.
in System.Reflection.RuntimeAssembly.InternalGetSatelliteAssembly(String name, CultureInfo culture, Version version, Boolean throwOnFileNotFound, StackCrawlMark& stackMark)
in System.Resources.ManifestBasedResourceGroveler.GetSatelliteAssembly(CultureInfo lookForCulture, StackCrawlMark& stackMark)
in System.Resources.ManifestBasedResourceGroveler.GrovelForResourceSet(CultureInfo culture, Dictionary`2 localResourceSets, Boolean tryParents, Boolean createIfNotExists, StackCrawlMark& stackMark)
in System.Resources.ResourceManager.InternalGetResourceSet(CultureInfo requestedCulture, Boolean createIfNotExists, Boolean tryParents, StackCrawlMark& stackMark)
in System.Resources.ResourceManager.InternalGetResourceSet(CultureInfo culture, Boolean createIfNotExists, Boolean tryParents)
in System.Resources.ResourceManager.GetObject(String name, CultureInfo culture, Boolean wrapUnmanagedMemStream)
in ZedGraphPlugin.Properties.Resources.get_menuIcon()
in ZedGraphPlugin.PluginRegion.GetMenuItems(SessionProfile sessionProfile)
in SMath.Controls.WorksheetEditor.CheckPluginKeyStrokes(InputKeys keys, Char keyChar)
in SMath.Controls.WorksheetEditor.KeyDown(KeyEventOptions e)
in SMath.UI.Desktop.DesktopWorksheet.(KeyEventArgs )
in System.Windows.Forms.Control.ProcessKeyEventArgs(Message& m)
in System.Windows.Forms.Control.WmKeyChar(Message& m)
in System.Windows.Forms.Control.WndProc(Message& m)
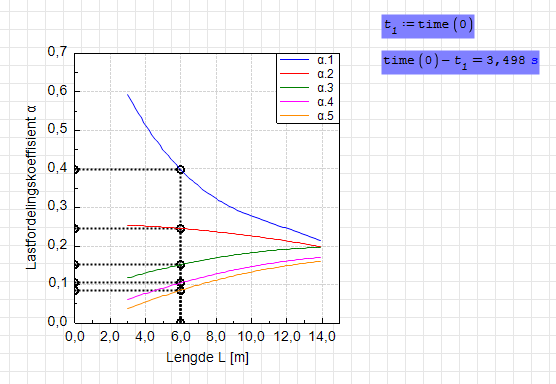
in System.Windows.Forms.NativeWindow.Callback(IntPtr hWnd, Int32 msg, IntPtr wparam, IntPtr lparam)edit: Affects first run of ZedGraph in this machine only, gone after the program was closed and launched again (SS 0.99.7691).
WroteHi,
Is it possible to speed up the plot on this sheet? I cant understand why it is so slow..
Best regards,
Hi. You can do some minor improvements like store α = α(x,a/L*x,X/L*x,Y) for avoid the function call many times, or try to put some eval() in some places. But my impression is that what really make the plot slow is that you divide by (x < s < f) five times in your plot. Notice that this results sometimes in α/0, and probably the internal plot routine isn't optimized for handle this situation quickly.
Best regards.
Alvaro.

I did the following:
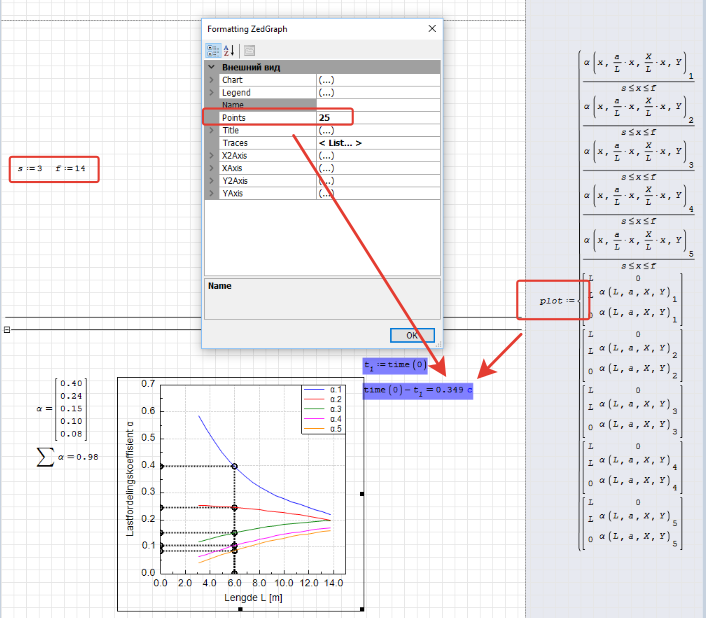
- delete the variable 'plot', and rather define the plot inside ZedGraph
- define domain (s, f) outside of the plot
- reduce points in ZedGraph to 25
All of this reduced the plot time from 3.6s to 0.2s. Thanks alot!
But how can I define the plot in a variable outside ZedGraph without increasing plot time? EDIT: as well as using time to evaluate the varible 'plot'.
Best regards,
WroteBut my impression is that what really make the plot slow is that you divide by (x < s < f) five times in your plot.
I had the same thought today, and some minutes at lunch time.. :P
So I tried to remove that x
In my opinion reducing the point number is making the difference (oh, and also alpha seems quite a intricate function, with nested "ifs" and inequalities... maybe a multiple call of that alpha is somehow heavy too?)
WroteWroteBut my impression is that what really make the plot slow is that you divide by (x < s < f) five times in your plot.
I had the same thought today, and some minutes at lunch time.. :P
So I tried to remove that x
In my opinion reducing the point number is making the difference (oh, and also alpha seems quite a intricate function, with nested "ifs" and inequalities... maybe a multiple call of that alpha is somehow heavy too?)
Thanks for the suggestions.
The alpha function is a "conditional" function that calls upon other functions depending on some conditions. The alpha function contains five rows.
From bottom to top it makes a correction to all the five values depending on whether the checkbox "samvirkepåstøp" is checked. The correction to alpha depends on the value of Y.
Further up the line it calls upon two different functions depending on the value of a. The two functions that are called upon are interpolated for values of x between L/2 and L/20, and values of Y between 0 and 3.
It's not really complicated, but there are some if's to make sure alpha calls upon the right functions.
More efficient ways of framing the functions are greatly appreciated.
Best regards,
WroteHi. You can do some minor improvements like store α = α(x,a/L*x,X/L*x,Y) for avoid the function call many times, or try to put some eval() in some places. But my impression is that what really make the plot slow is that you divide by (x < s < f) five times in your plot. Notice that this results sometimes in α/0, and probably the internal plot routine isn't optimized for handle this situation quickly.
Best regards.
Alvaro.
Where can I store α = α(x,a/L*x,X/L*x,Y)?
I have tried using eval() but it only seems to slow it down.
when a
I cant believe these functions should be so intense to plot?
best regards,
WroteWhere can I store α = α(x,a/L*x,X/L*x,Y) ?
Do you mean store like in secret cabinet ?
You can spool to file a function, complicated function.
Can't help ... red top to bottom .
Cheers ... Jean
Wrote
Where can I store α = α(x,a/L*x,X/L*x,Y)?
Twice:
Wrote
I have tried using eval() but it only seems to slow it down. I cant believe these functions should be so intense to plot?
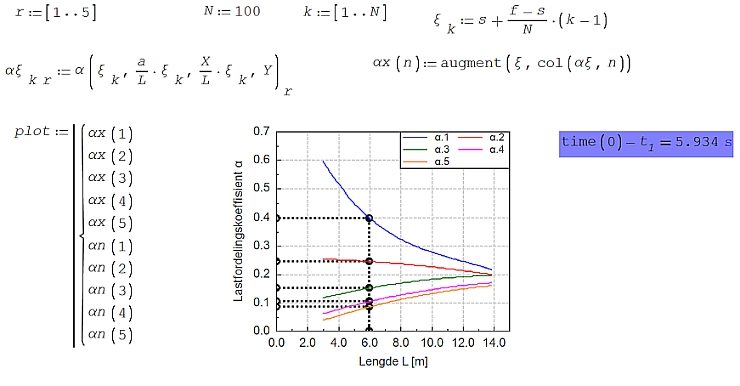
That's because x remains undefined and values are assigned in the plot plugin. So, the speed depends on the code for the plugin and the SMath's handle of vectors, and eval() make the evaluation slower in those cases. You can also discretize the problem for inspect if eval() can have any effect. I mean, you can try to use eval() at some place with this other code for plot:
slow plot.sm (352.23 KiB) downloaded 929 time(s).
Best regards.
Alvaro.
values of a≥L/2 plots in ~0.7 sec and a
reducing number of points from 100 to 25 helps reduce time further, but that is not an ideal solution imho.
Best regards,
slow plot-2.sm (313.08 KiB) downloaded 947 time(s).
EDIT:
compiling everything into one nested function has further speed up the time to ~0.5 sec, and eliminated the difference in time between a≥L/2 and a
Is this as fast as it gets?
Best regards,
slow plot-3.sm (102.6 KiB) downloaded 999 time(s).
Wrote
Is this as fast as it gets?
Hi. Think in terms of what you're sending to the plugin. For instance, try to evaluate symbolically just one of the el(α(x,a/L*x,X/L*x,Y),1)/lele(x,x.min,x.max). I paste it here as string:
cases(mat({10000*(125000000*(46856-7185*x)+67312500000*x^2)-18750000000000*x^3}/62500000000000000,{5000000000*(25606-17*x)-145000000000*x^2}/500000000000000,{312500000*(7232+1621*x)-16562500000*x^2}/31250000000000,{1000000000*(745+1917*x)-54000000000*x^2}/100000000000000,{250000000*(-433+424*x)-2950000000*x^2}/5000000000000,5,1),x/3≥x/2,mat({4500000000000000000*cases(x/4,(x/20
The use of eval() just make things worst. And that only for one curve, you plot five. If you want to optimize your code you can use the component as a parameter or discretize the range domain.
Best regards.
Alvaro.
Wrote
Hi. Think in terms of what you're sending to the plugin. For instance, try to evaluate symbolically just one of the el(α(x,a/L*x,X/L*x,Y),1)/lele(x,x.min,x.max). I paste it here as string:
cases(mat({10000*(125000000*(46856-7185*x)+67312500000*x^2)-18750000000000*x^3}/62500000000000000,{5000000000*(25606-17*x)-145000000000*x^2}/500000000000000,{312500000*(7232+1621*x)-16562500000*x^2}/31250000000000,{1000000000*(745+1917*x)-54000000000*x^2}/100000000000000,{250000000*(-433+424*x)-2950000000*x^2}/5000000000000,5,1),x/3≥x/2,mat({4500000000000000000*cases(x/4,(x/20
The use of eval() just make things worst. And that only for one curve, you plot five. If you want to optimize your code you can use the component as a parameter or discretize the range domain.
Best regards.
Alvaro.
Hi. What do you mean by the highlighted part?
Best regards,
Wrote
Hi. What do you mean by the highlighted part?
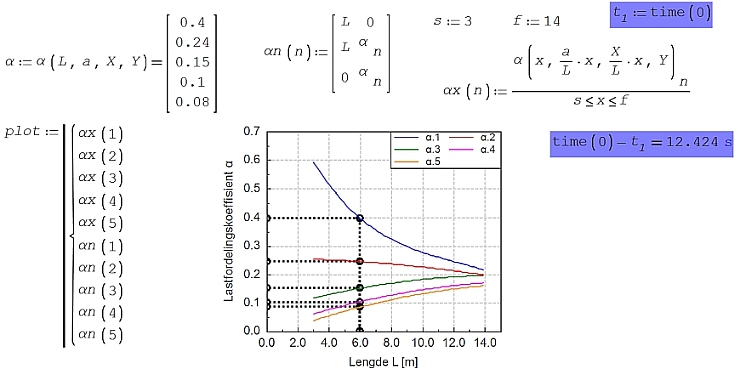
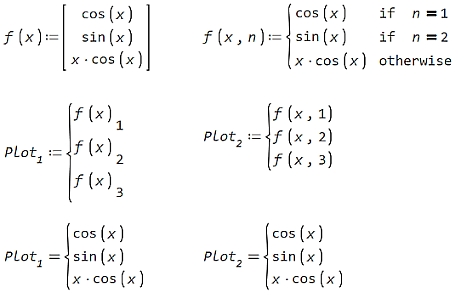
Alpha is a vector. You send all the five components to the plot plugin each time that you need to plot only one. The plugin first evaluate the five components before take the element for make the plot. You can modify your definition of alpha for take the component number as parameter and return just only one curve, not the five, as is showing in the attach. Compare the symbolic results at the end.
slow plot-3.sm (157.48 KiB) downloaded 997 time(s).
Best regards.
Alvaro.
Wrote
Alpha is a vector. You send all the five components to the plot plugin each time that you need to plot only one. The plugin first evaluate the five components before take the element for make the plot. You can modify your definition of alpha for take the component number as parameter and return just only one curve, not the five, as is showing in the attach. Compare the symbolic results at the end.
slow plot-3.sm (157.48 KiB) downloaded 997 time(s).
Best regards.
Alvaro.
So your suggestion is to make alpha.1 through alpha.5 as separate functions rather than combining all into one vectorfunction?
I will look into that to see if that improves speed

But the sheet you attached plots much slower than the last one I uploaded?
Best regards,
Wrote
So your suggestion is to make alpha.1 through alpha.5 as separate functions rather than combining all into one vectorfunction?
I will look into that to see if that improves speed
Hi. Not necessary, but it could be an improve. You can preserve the structure if simplify cases() or if() in the symbolic evaluation because that is what gets the plot plugin. Actually problem here is with the el() function that sometimes takes the element of the matrix and others remains unevaluated. For example, here el() works fine:
Best regards.
Alvaro.
Wrote
Hi. Not necessary, but it could be an improve. You can preserve the structure if simplify cases() or if() in the symbolic evaluation because that is what gets the plot plugin. Actually problem here is with the el() function that sometimes takes the element of the matrix and others remains unevaluated. For example, here el() works fine:
Best regards.
Alvaro.
I think I understand.
At the same time I think that would not be possible because of what happens in the last part of the function, where a correction factor is applied to all the elements of the vector. To determine the correction factor, all the elements of the vector must be evaluated.
Best regards,
Wrote
Best regards.
Alvaro.
The function Cases() just came to my attention from one of my posts. How did you add the second "If" row? It does not have a drag bar like matrices and inserting Cases() in the boxes is not what is shown in the graphic.
Wrote
The function Cases() just came to my attention from one of my posts. How did you add the second "If" row? It does not have a drag bar like matrices and inserting Cases() in the boxes is not what is shown in the graphic.
Press Shift + , twice for every row you want to add.
Best regards,
- New Posts
- No New Posts