1 Pages (4 items)
Newbie question: why this picewise function not plot? - Messages
#1 Posted: 11/13/2023 3:13:03 PM
Hello , I'm new to Smath , when trying to plot a picewise function using x-y plot or native 2D plot , I run into problem below:
the plot does not appear , but when i pass individual number as the value of variable x , it can give me correct result.
can you give me some advice about solving it? many thanks!
File not found.File not found.
I have also tried to change the form of th function , see below , but still it does not help.
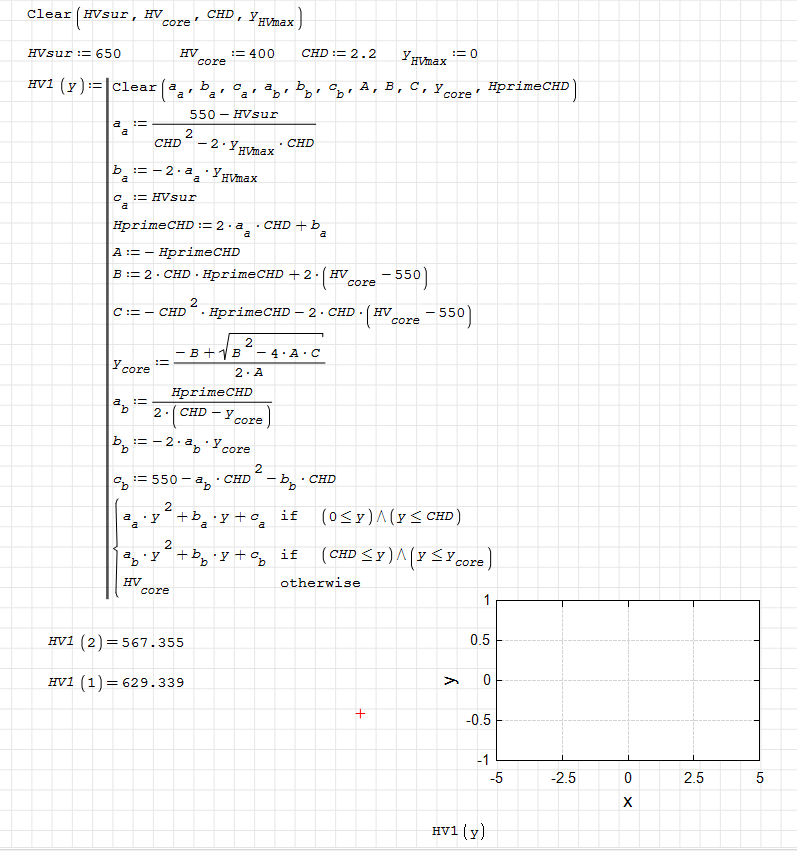
the plot does not appear
, but when i pass individual number as the value of variable x , it can give me correct result. can you give me some advice about solving it? many thanks!
File not found.File not found.
I have also tried to change the form of th function , see below , but still it does not help.
#2 Posted: 11/13/2023 3:43:28 PM
Did you try to adjust the y axis range? Both plot regions don't have auto-adjustment.
![2023-11-13 08_45_46-SMath Solver - [picewiseFunction-not-plot.sm_].png](/en-US/files/Download/qA7Do7/2023-11-13-08_45_46-SMath-Solver---[picewiseFunction-not-plot.sm_].png)
Technische Mechanik mit SMath Studio: https://link.springer.com/book/10.1007/978-3-658-50592-9
#3 Posted: 11/13/2023 4:07:42 PM
WroteDid you try to adjust the y axis range? Both plot regions don't have auto-adjustment.
yes! it works, sincere thanks for your warm-hearted advice!

#4 Posted: 11/13/2023 5:43:56 PM
With X-Y Plugin you could anyway set up auto-adjustment of the axis range, please check Martin's (super-useful) Interactive Handbook to see how to use the related parameters correctly.
This feature is not available in native SMath plot.
Bye
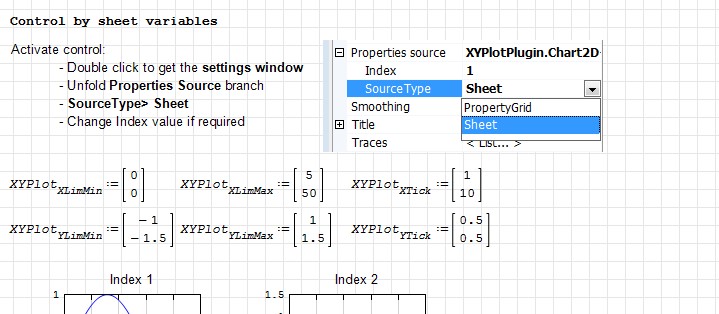
This feature is not available in native SMath plot.
Bye
1 users liked this post
Oscar Campo 11/13/2023 8:42:00 PM
1 Pages (4 items)
- New Posts
- No New Posts