This is a continuation of learning to plot in Smath, heck learning Smath.
I have been able to get the XYplots correctly done.
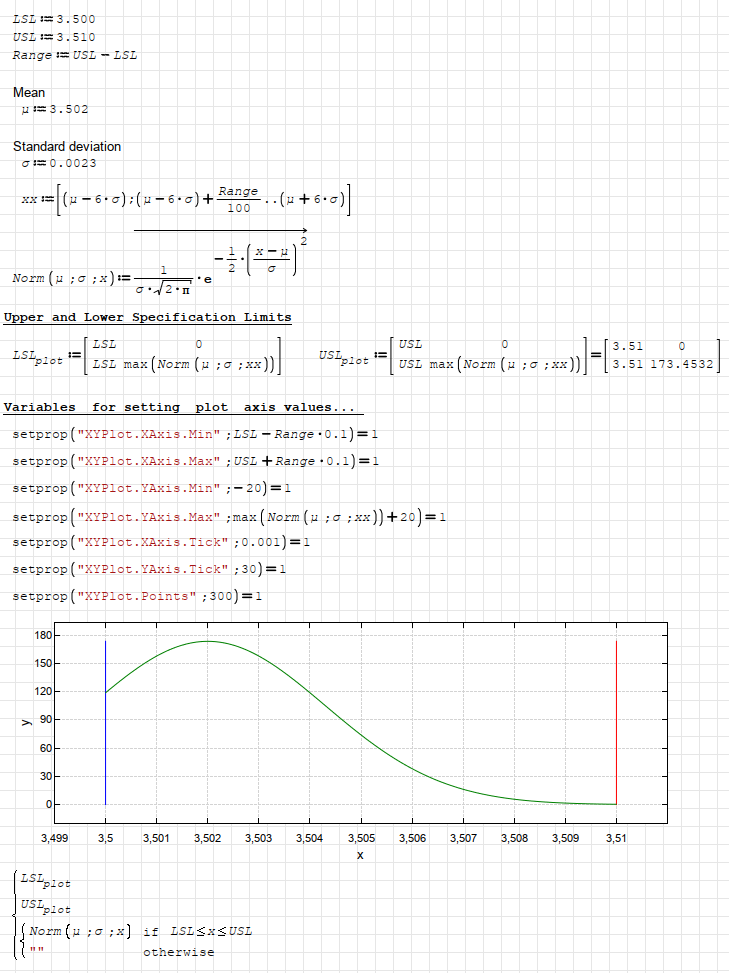
But now I am searching for a solution to define the x- and y-axis min maximum values using calculated values (See the
Variables for setting plot axis values ... section).
I am aware formatting X-Y Table, but have not been successful in using it as a place holder for the calculated values, all seems to be static.
Looking forward to your responses.
Lloyd
2D Plot - Axis Control.sm (13.1 KiB) downloaded 1020 time(s).