[2D plot] Plot of points in piecewise functions - Messages
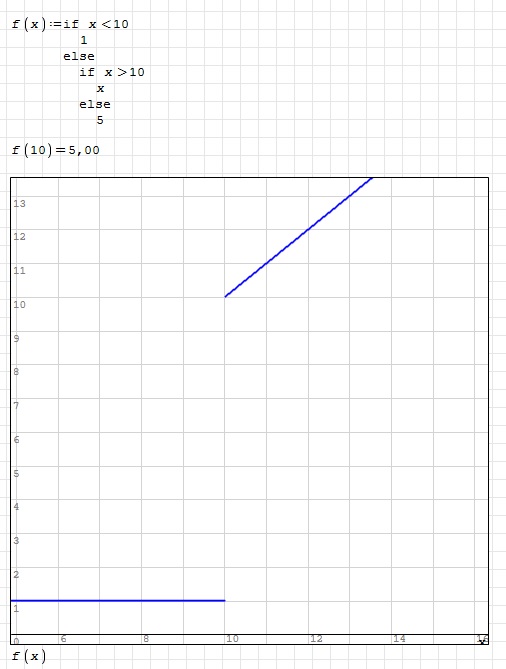
I have a problem with simple equation. In case of my function, f(10) is equal to 5 but there is no "dot" of such value on the graph.
Please tell me how it should look like.
Where is the dot.sm (3.2 KiB) downloaded 1140 time(s).
Best regards.
Mroczak

Best regards,
Mroczak
Another option, defining the range discretely.
Where is the dot discrete.sm (5.05 KiB) downloaded 1155 time(s).
Best regards,
Mroczak

Wrotethink the issue is the auto-generated range does not include the point x=10 exactly and therefore never reaches the point where f(x) = 5
That's part of "the point". The function has to be drawn on the canvas, thus it is calculated for each pixel, and each pixel correspond to a value that depends on the range (first and last values visible), and even on the number of pixels (the width of the canvas).
You can figure it easily placing a breakpoint in the plot placeholder and looking at the values of x.
![2018-11-20 19_07_51-SMath Studio - [Where%20is%20the%20dot.sm_].png](/en-US/files/Download/mGMMgC/2018-11-20-19_07_51-SMath-Studio---[Where%20is%20the%20dot.sm_].png)
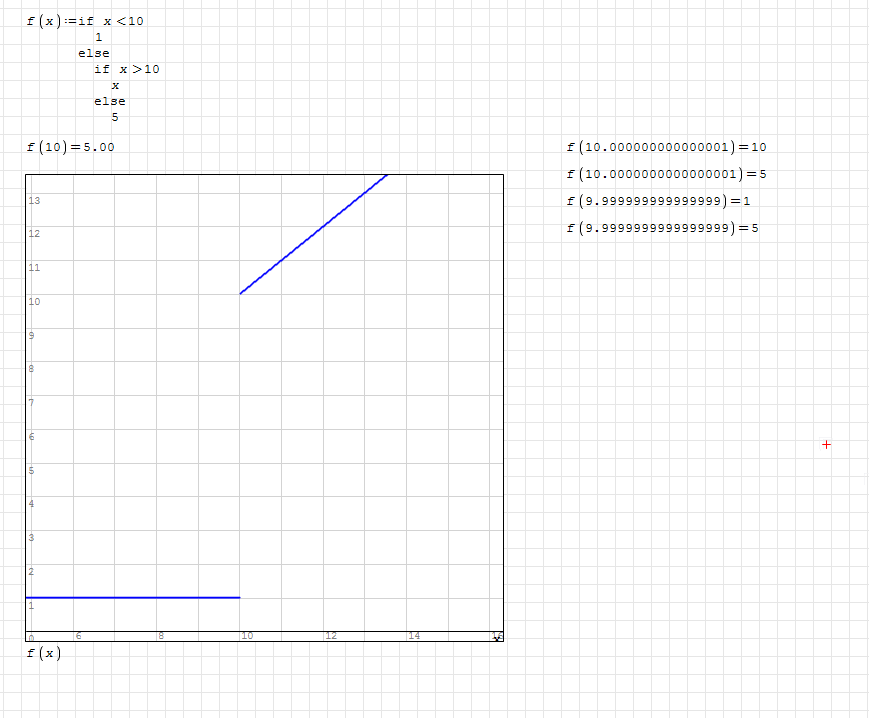
You must be very lucky to hit exactly 10.000000000000000 (15 digits)
the issue -in my modest opinion - is only on the plot side; your definition of the function and its discontinuity works fine and the value f(10) is evaluated correctly ..but plotting a function with discontinuity requires a discontinuity analyzer i.e. you need ( I mean the developer of the 2d Plot that I guess is Andrey ) to develop a module that find the discontinuities , analyze them and behaves accordingly ( these are at least of 3 different types for functions of one variable ) and this is not so easy to handle.
This remembers me 40 years ago when on a Sperry Univac I had to develop in fortran by myself something to plot correctly the angular patter of the radiation scattered when a laser beam is sent in a spray of fuel droplets, this produces at some particular angles rainmbows so discontinuities in the pattern that created many troubles to the offline plotter I were using at the time, took me a lot of effort ( and euristics ) to analyze and try to solve this issue.
Best regards
Franco
WroteI have a problem with simple equation. In case of my function, f(10) is equal to 5 but there is no "dot" of such value on the graph.
Please tell me how it should look like.
Your setup is not correct. Once in a while, undefined condition(s) do not reflect.
In very rare instances, it's the other way around, i.e: one of the condition must
be undefined wrt the algorithmic suite [typical => De Boor spline point].
Where is the dot discrete.sm (6.82 KiB) downloaded 1120 time(s).
Wrote
the issue -in my modest opinion - is only on the plot side
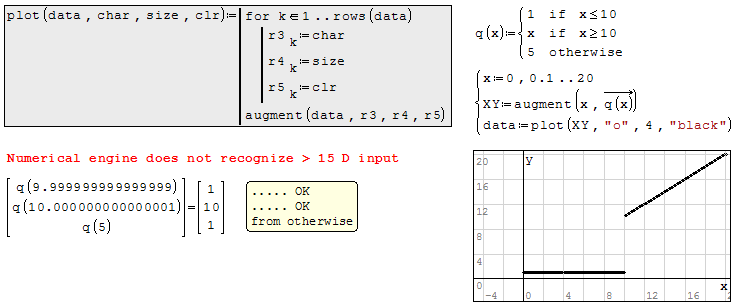
Yes and no. You cannot really expect the program to know to evaluate/plot at a specific point for any arbitrary function. Additionally as shown in the figure below one can produce "incorrect" results by exploiting the fact that we're performing calculations on a discrete system.
It may seem like the plot "should" be able to detect an infinitesimal point at x=10, but what if we redefined it for x=pi or any arbitrary number. It becomes very difficult to find that single point discontinuity in the function.
I think in an instance like this, the user needs to either add some "fudge-factor" to the function or define the range manually to include the point(s) in question.
WroteWrote
the issue -in my modest opinion - is only on the plot side
Yes and no. You cannot really expect the program to know to evaluate/plot at a specific point for any arbitrary function.
Hi. Yes, you can. With the normal issues for symbolic or numeric manipulations. And as frapuano talk, in some moment we need to implement some code for handle singularities. As an example, maybe too much specific, but about finite jumps, you can see
https://en.smath.info/forum/yaf_postst14910_Round.aspx and the implementation of discontinuous plots in round.sm (69.17 KiB) downloaded 1333 time(s).
Maple have following functions, but need readlib for the following two:

Also can use this option for plots:
Best regards.
Alvaro.
Wrote
Maple have following functions, but need readlib for the following two:
Alvaro.
I see your point. I found a piecewise plotting example with removable discontinuity in maple here (need to scroll down).
A couple points to note. Generally, I don't think something like fdiscont would work for piecewise functions with single point discontinuities or perhaps even jump continuities. It mentions issues with these in the description.
I notice that both Maple and Matlab have "piecewise" functions. I assume that in those environments the "piecewise" functions may be an indicator to the "plot" function that specific conditions exist for which the function needs to be evaluated. Therefore the plot function will evaluate the boundary conditions.
Perhaps in SMath something similar could be implemented s.t. when a function is passed into the plot and it is specified as a piecewise function, it will evaluate any conditions specified within the range that aren't part of the auto-generated range.
I'm not certain if it's necessary to indicate that a function is intended to be piecewise continous within SMath or if SMath is smart enough to determine intent by the structure of the function itself. I do not think, generally, any function with conditionals can be considered piecewise, but I'm not sure if that's true.
WrotePlease tell me how it should look like.
Answer @ post # 8. Conditions are either true/false... Not maybe YES/maybe NO.
Wrote
I'm not certain if it's necessary to indicate that a function is intended to be piecewise continous within SMath or if SMath is smart enough to determine intent by the structure of the function itself. I do not think, generally, any function with conditionals can be considered piecewise, but I'm not sure if that's true.
Hi. The only "true" piecewise function is Dirac's delta ... and it's a distribution, not a function. In maple you can convert from if's or some other to piecewise or step functions with 'convert', and in matlab (mupad, actually) with 'coerce'. Numeric or symbolic procedures for handling discontinuous plots have a lot of issues, and only works for "normal" functions, if not, think about how to implement procedures for plot x/sin(1/x) near zero.
But answering your question, my guess is not: assume that you implement an amazing routine for say that a number is rational or not (and then irrational: mathematica have something like that, or at least Wolfram think this). And then construct this function, and see this unusual, for say something, property
Best regards.
Alvaro
WroteI'm not certain if it's necessary to indicate that a function is intended to be piecewise continous within SMath or if SMath is smart enough to determine intent by the structure of the function itself. I do not think, generally, any function with conditionals can be considered piecewise, but I'm not sure if that's true.
Mon ami, your point is SO fundamental
Those things appeared ad-nauseum in Mathsoft Collaboratory.
Mathcad up to 11, was a bit more understanding, but wrong by principle
because confusing because not telling the truth. A piece-wise function
MUST be specified completely. On that, Smath is absolutely correct.
There are other things under the hood related to this discussion:
Integration of erf(x), and Gamma(x), the integrand must be vectorized.
Indirectly, it kind of depends upon of discontinuous approximation
of these two functions, the only two I have detected.
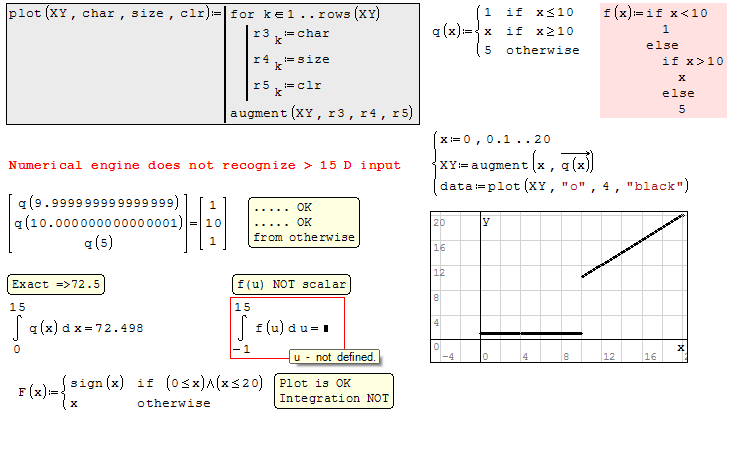
Most/most important about discontinuous is the major difference between
if/else and if/otherwise. Generally, they do the same but they aren't.
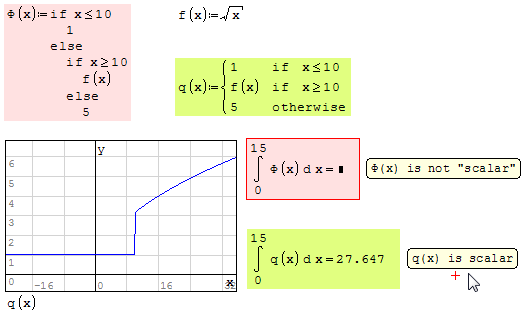
EXPLAIN: if/else is not scalar and it will not integrate a completely
specified if/else function. On the other hand, if/otherwise is scalar
thus will integrate. They both plot the same to add to the confusion.
Demonstrated => Integrate Discontinuous [Nuance].
Demonstrated => Where is the Dot Discrete.
It may even be more important if the path of integration is discontinuous.
Jean
Where is the dot discrete.sm (19.27 KiB) downloaded 1132 time(s).
Integrate Discontinuous [Nuance].sm (24.75 KiB) downloaded 992 time(s).

WroteHello!
I have a problem with simple equation. In case of my function, f(10) is equal to 5 but there is no "dot" of such value on the graph....
In a more compact form you can view no discontinuities
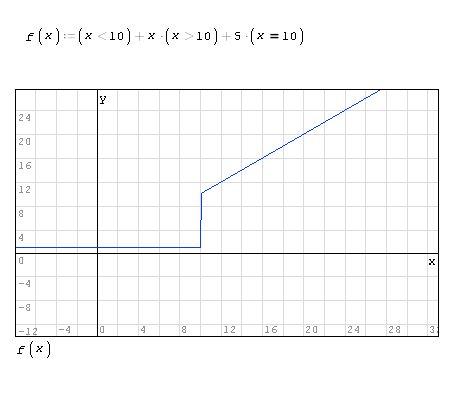-10.54.01-a.-m..png)
 , just for sake of understanding; looks to me that the merging of several OR operations should be linked to this different (... and positive )behaviour.
Best regards
Franco
Wrote...It would be interesting to know why it works this way , just for sake of understanding; looks to me that the merging of several OR operations should be linked to this different (... and positive )behaviour.
Best regards
Franco
They behave the same way; in the first post the plot was made with "Graph by points" enabled.
Best regards
Franco
Mathcad plots on ½ pica thus plots straight lines, thus not fine/pleasant look.
Smath plots on pixel thus the discontinuous were there is no ½ pixel.
A scalar function is a function that runs on a vanishing iterator 'x' .
Smath does not calculate ln(,), exp(,) ... it fetches from Windows.
Most if not all functions are approximations of 21 decimals.
i.e: Normalized Padé Rational Fractions.
Result may be only 18 Decimals. Thus, by convention results are
truncated to 15 decimals. Symbolic Engines is another story.
High accuracy Main-Frames may run Chebyshev of very high numerical
stability 25 decimals [typical Clenshaw ...]
Normalized Rational Fraction approximates on various best range wrt
to minimal arithmetic operations. Each function has its own specific range
generally very small. More numerical maths kind of scale the base range
to accommodate the 'x' of greater value than the base approximation,
naturally up to the max of the result < 10^307.
Before the event of rational approximations the first IBM used
continued fraction for the principal ln(x), exp(x), sqrt(x) ...
Can't help more about unknown math suite/use of the proposal.
Wrotemath suite ...
...in the if/otherwise '5' has no meaning.
Backspace to delete 5, type ".
- New Posts
- No New Posts