1 Pages (4 items)
Type of Graphs - Linear - Linear, Linear-Log, Log-Log - Messages
#1 Posted: 1/17/2017 8:50:12 PM
Hello,
Can we have graphs of data
Linear - Linear, [Yes]
Linear-Log, ?
Log-Log, ?
Thank you,
Basile
Can we have graphs of data
Linear - Linear, [Yes]
Linear-Log, ?
Log-Log, ?
Thank you,
Basile
#2 Posted: 1/18/2017 4:20:37 AM

Hi,
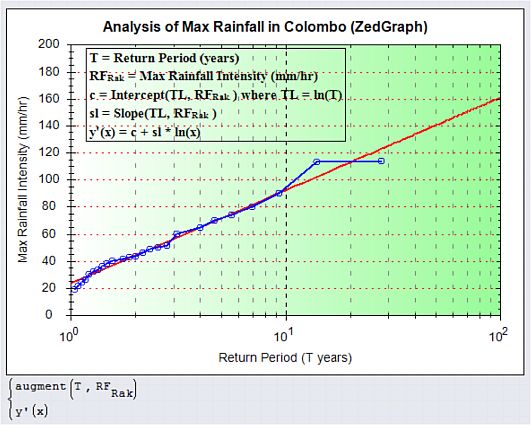
I also tried semi-log using X-Y Plot, but could not find a way.
However, it is possible using ZedGraph plugin.
I also tried semi-log using X-Y Plot, but could not find a way.
However, it is possible using ZedGraph plugin.
Look within!... The secret is inside you.
Best Regards
Eng. NDTM Amarasekera - Sri Lanka
2 users liked this post
#3 Posted: 1/18/2017 1:05:03 PM
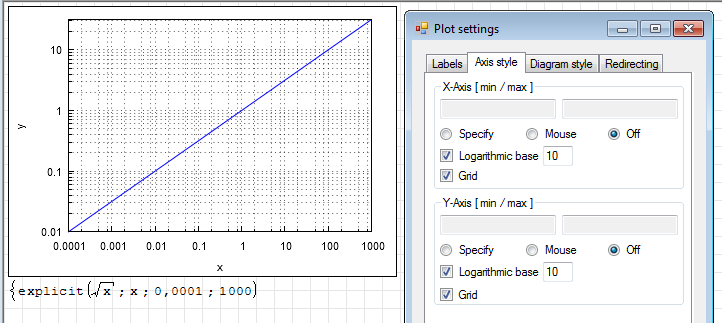
loglog and semilog plots can be created with Maxima Draw.
Insert> Maxima> Maxima Draw2D
Then you can specify graphics objects. There is partial support for the settings in the context menu. These settings also can be specified in the graphics command list.
An example with log plot can be found here
loglog.sm (17.73 KiB) downloaded 1304 time(s).
Insert> Maxima> Maxima Draw2D
Then you can specify graphics objects. There is partial support for the settings in the context menu. These settings also can be specified in the graphics command list.
An example with log plot can be found here
loglog.sm (17.73 KiB) downloaded 1304 time(s).
Technische Mechanik mit SMath Studio: https://link.springer.com/book/10.1007/978-3-658-50592-9
4 users liked this post
sergio 1/18/2017 3:34:00 PM, Radovan Omorjan 1/18/2017 3:36:00 PM, Davide Carpi 1/18/2017 7:51:00 PM, frapuano 2/18/2018 8:46:00 AM
#4 Posted: 1/18/2017 7:37:32 PM
WroteHello,
Can we have graphs of data
Linear - Linear, [Yes]
Linear-Log, ?
Log-Log, ?
Thank you,
Basile
I don't catch "ndtma" plot, it looks to me a "qq plot".
This type of plot is on linear/linear. log scale is a
means to visualise globally large range of values.
You could probably manage your demand inspired from
the "logpts" attached.
Jean
Utilities logpts.sm (42.29 KiB) downloaded 1174 time(s).
1 Pages (4 items)
- New Posts
- No New Posts