1 Pages (4 items)
S-N diagram - ZedGraph - Messages
#1 Posted: 4/11/2024 12:24:21 AM
Hello
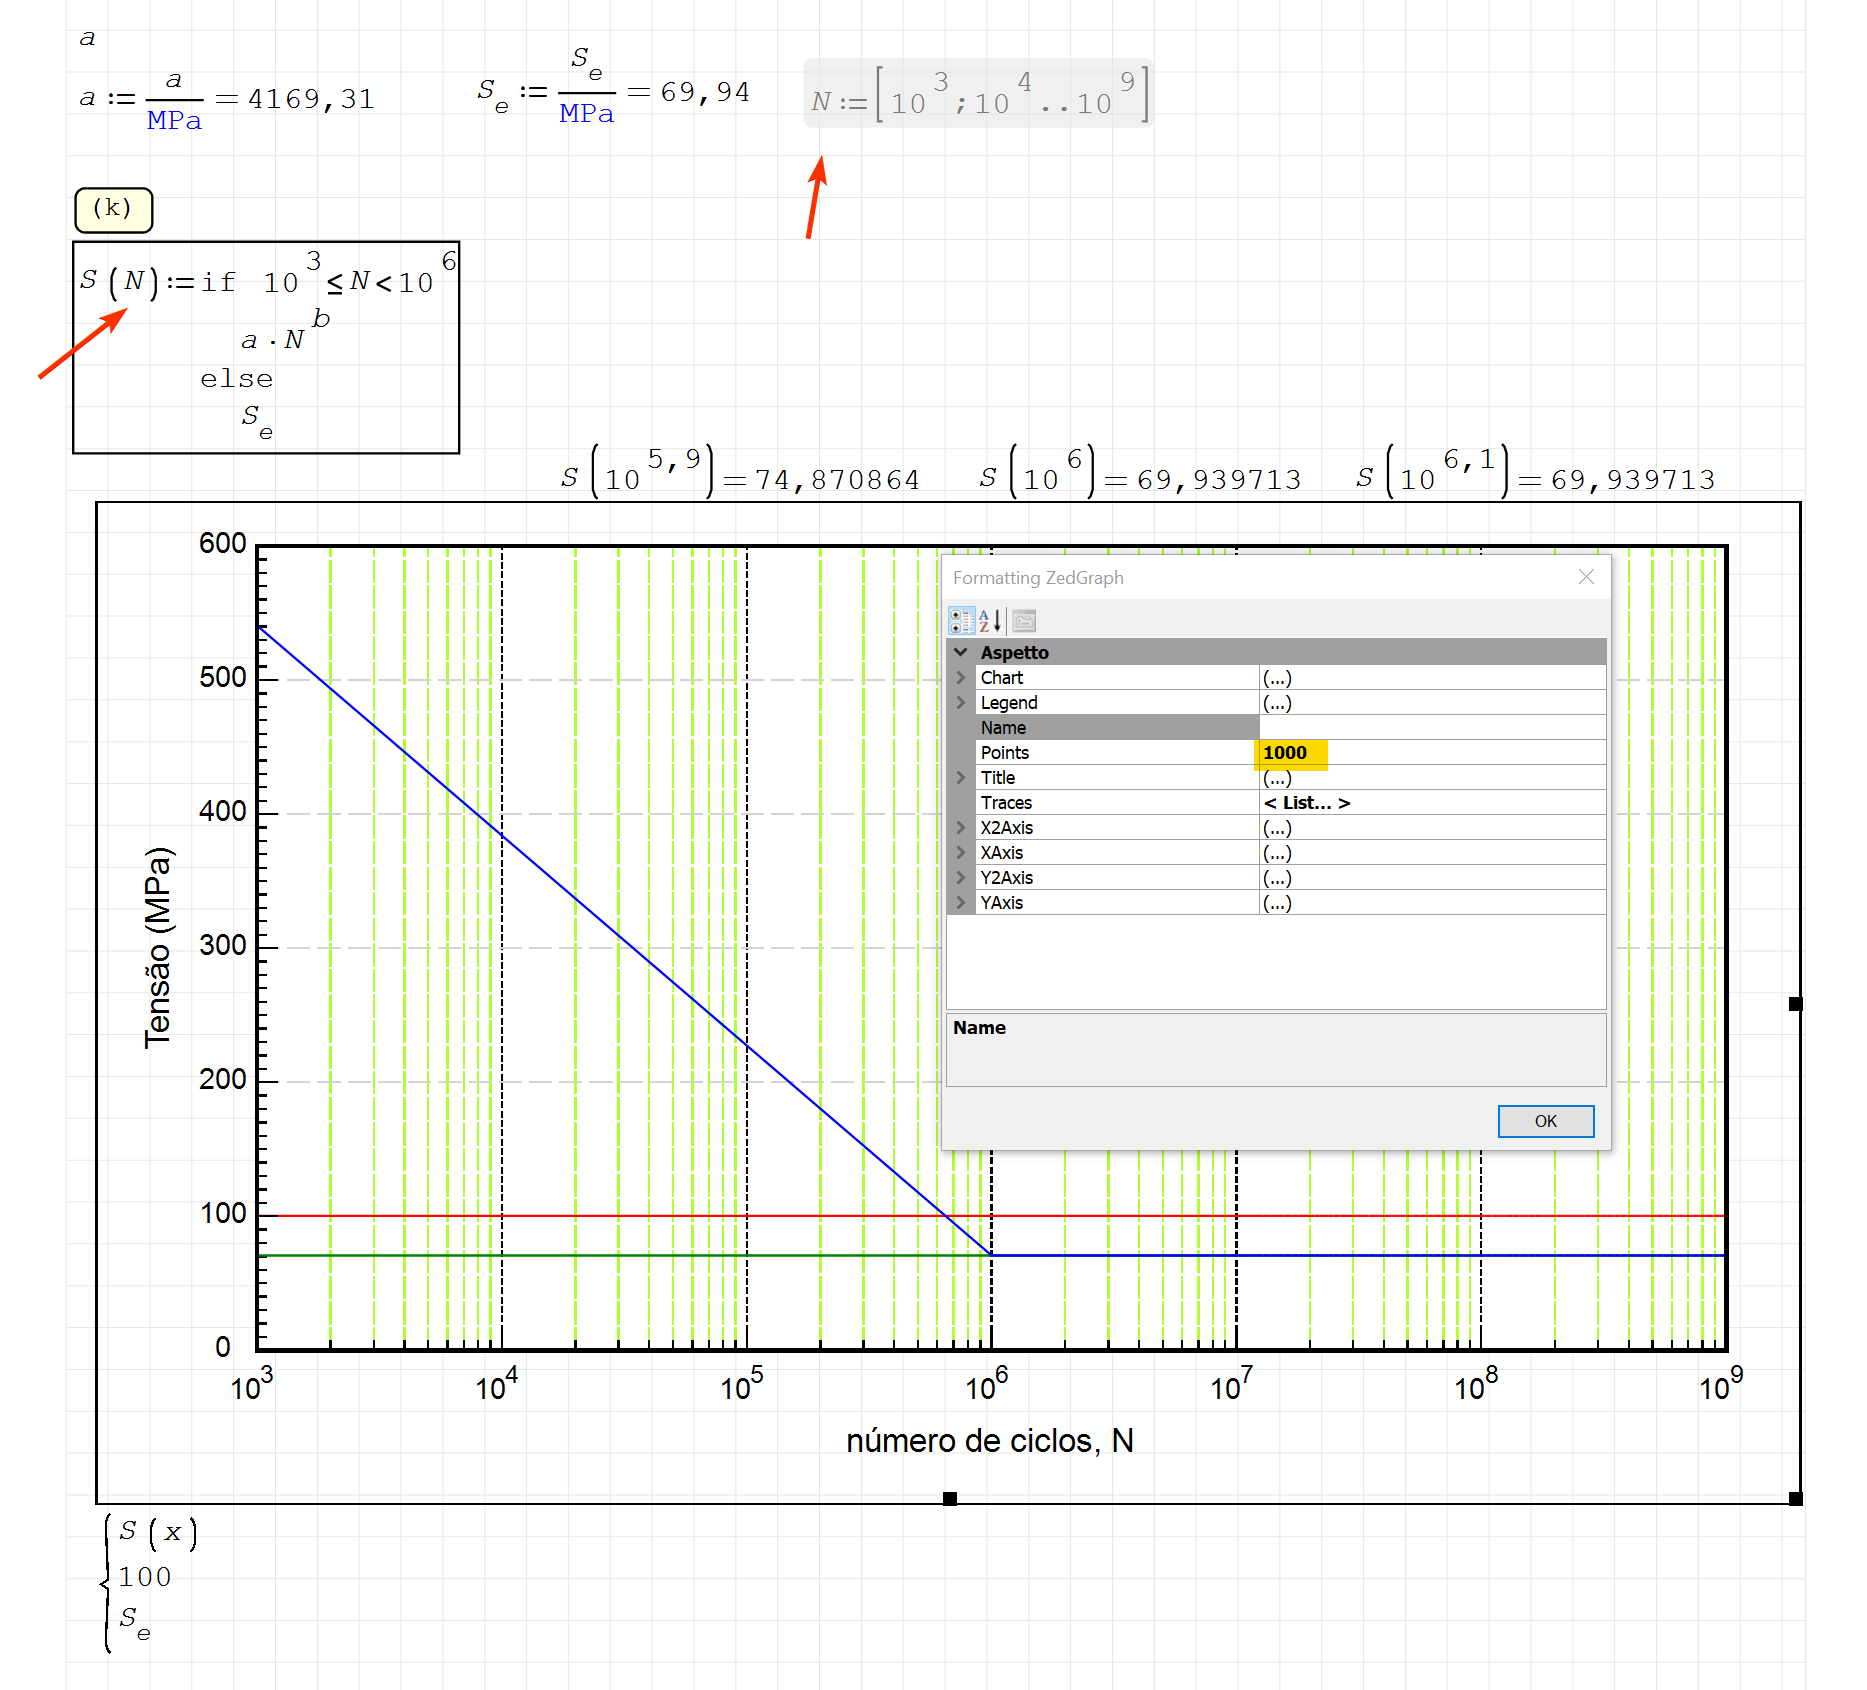
I'm trying to create an S-N diagram (Stress – Number of cycles) using a logarithmic scale in SMATH STUDIO. I'm using the ZedGraph plugin to generate the diagram, but the result on the graph is different from what I expected. The inclined line should end at the coordinate of 69.9 (y) and 10^6 (x), but it's always ending at 69.9 (y) and 10^7 (x). I've solved this same problem in MathCAD, and the result is correct, but in SMATH STUDIO, this discrepancy occurs. Could someone help me identify where the problem causing this discrepancy is?
Capitulo 06 - Exemplo 06.01 - Determinacao de diagramas S N estimados para materiais ferrosos.sm (108.23 KiB) downloaded 1421 time(s).
#2 Posted: 4/11/2024 2:54:54 AM

Simply increase the number of points of the graph resolution (for example from 100 to 1000).
I also don't like that you defined "N" as a vector and then used "N" as a variable; I deactivated it because it's not needed anyway
sergio
I also don't like that you defined "N" as a vector and then used "N" as a variable; I deactivated it because it's not needed anyway
sergio
#3 Posted: 4/11/2024 4:19:25 AM
I'm really grateful for your help. Thanks a lot!
Sono davvero grato per il tuo aiuto. Grazie mille!
Sono davvero grato per il tuo aiuto. Grazie mille!
#4 Posted: 4/11/2024 4:24:38 AM

WroteHello
I'm trying to create an S-N diagram (Stress – Number of cycles) using a logarithmic scale in SMATH STUDIO. I'm using the ZedGraph plugin to generate the diagram, but the result on the graph is different from what I expected. The inclined line should end at the coordinate of 69.9 (y) and 10^6 (x), but it's always ending at 69.9 (y) and 10^7 (x). I've solved this same problem in MathCAD, and the result is correct, but in SMATH STUDIO, this discrepancy occurs. Could someone help me identify where the problem causing this discrepancy is?
Capitulo 06 - Exemplo 06.01 - Determinacao de diagramas S N estimados para materiais ferrosos.sm (108.23 KiB) downloaded 1421 time(s).
Here is your file solved by the method I use. I simplify the graphing process by using connected points and find the number of cicles by the function FidRoot().
(I also included a Fatigue Utilities snippet in the top of the file, please take a look)
Determinacao de diagramas S N estimados para materiais ferrosos OTHER WAY.sm (624.56 KiB) downloaded 1590 time(s).
1 users liked this post
sergio 4/11/2024 4:22:00 PM
1 Pages (4 items)
- New Posts
- No New Posts