1 Pages (5 items)
"Flipping" axes, 2D plot - graphing - Messages
#1 Posted: 4/1/2019 12:40:56 AM
Hi all,
New user, so learning my way around. I haven't been able to find a way to do the follow.
What I would like to do is plot a function where the abscissa is shown on the vertical axis, and the ordinate on the horizontal axis. The function shows wind speed as a function of height, so it's more natural to plot the height values vertically.
Thanks!
#2 Posted: 4/1/2019 1:33:32 AM
#3 Posted: 4/1/2019 1:50:45 AM
WroteHi Rod. I guess that the easy way is: (1) discretize the domain, (2) vectorize the co-domain and finally (3) plot augmenting in the "reverse" order.
Thanks. That's exactly what I needed. I don't think I would have ever guessed that sequence of commands.
#4 Posted: 4/1/2019 9:21:48 AM
WroteThe function shows wind speed as a function of height
That is no problem as you have it exemplified already.
Now, if you measure the wind speed and want to know the height
the problem is inversing the function. That is a much different story.
Many functions have an inverse from maple, but generally not.
It is always possible from other solvers in discrete mode,
then re-fit best by a model function or simply interpolate.
Attach your wind speed function or the data set.
A technical example of what I'm trying to explain is the temperature
measurement with the Platinum thermometer. BIPM gives resistance vs
temperature. But you measure resistance, then the problem is to read °C.
Wind speed is very local, that's why you may just have data.
Please, feel comfortable in Smath Community, plenty of "cats in the hat"
Cheers ... Jean
rodp1.sm (22.57 KiB) downloaded 931 time(s).
#5 Posted: 4/1/2019 10:16:43 AM
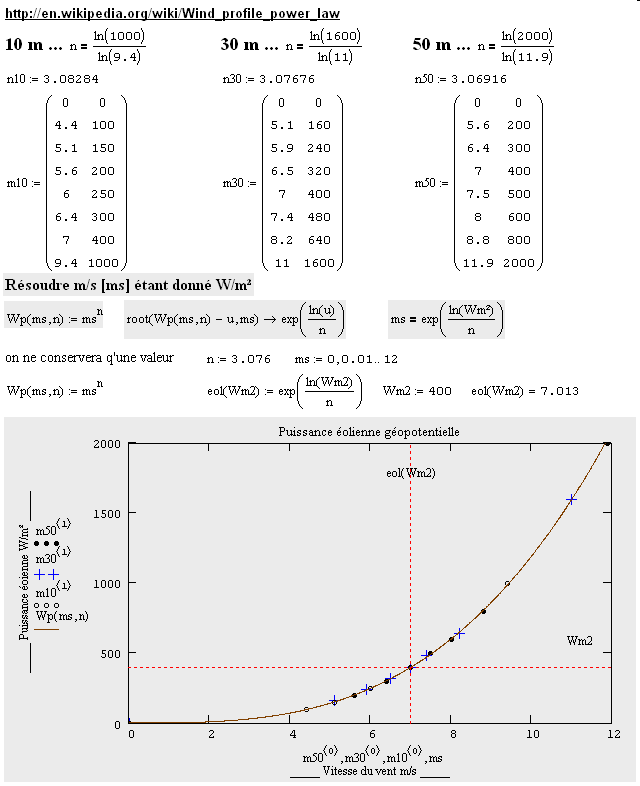
WroteWind speed is very local, that's why you may just have data.
The Windmill project was done Mathcad 11 [W vs speed].
Here is an image to download ... being converted Smath
Expect today Smath document. Observe the function inverse.
1 Pages (5 items)
- New Posts
- No New Posts