1 Pages (8 items)
Cant find "range" feature - Messages
#1 Posted: 5/4/2009 7:27:37 AM
Hi there,
first of all thanks a lot for the awesome software.
It seems to be exactely what I was looking for, but I have a problem with a certain function I can use in MathCAD but can not find in SMath.
When I have a funktion of d and I would like to get the calculated results of that function for d being 0,100..1000
In MathCAD it would look like:
f(d)= blablabbla
d=0,100..1000
with the result be presented in a table
f=f(d=0)
f(d=100)
f(d=200)
...
f(d=1000)
A sample was linked in the forum already, but HERE it is again
Maybe somebody can help me.
#2 Posted: 5/4/2009 10:41:09 AM

Hello.
We're still working to implement Range function to SMath Studio. Hope, this work will be finished till next release.
We're still working to implement Range function to SMath Studio. Hope, this work will be finished till next release.
#3 Posted: 5/4/2009 1:48:06 PM
Thanks for the answer - after a bit more forum browsing I found that I was not the first one who is missing the feature.
Anyway, I am trying to get a graph showing a function that depends another function, but I just do not get it to work.
Maybe somebody can help - because I do not want to spend any more hours in fiddling.
I have created a sample file which you can find HERE
Anyway, I am trying to get a graph showing a function that depends another function, but I just do not get it to work.
Maybe somebody can help - because I do not want to spend any more hours in fiddling.
I have created a sample file which you can find HERE
#4 Posted: 5/4/2009 2:32:32 PM
I have downloaded your file and have opened it with SMath Studio 0.80. Here is screen:

#5 Posted: 5/4/2009 2:38:46 PM
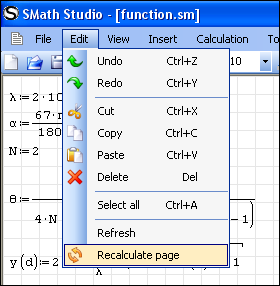
I don't know what localization of the program you use, so in some cases you should use sh() instead of sinh(). Try to change this function. the second way: you can change options of the program to accept sinh():

And after you will change it you should recalculate page via main menu:
And after you will change it you should recalculate page via main menu:
#6 Posted: 5/4/2009 8:33:49 PM
Hi Riddler,
I also tried your file and there are three problems I've found:
1. you need to define n1
2. to make T vs d you have to use the following syntax: T(d)=...sinh(y(d)) ... I tried this and it worked.
3. The function you intend to plot leads to 1/infinity (since sinh of a huge number is more or less infinity), and as you defined d has to be something the size of 10^-7 to keep values of T in a reasonable order of magnitude. But there is currently no possibility to define the plot borders so, actually it is impossible to plot this function!
--> @ smath:
I tried to use the limit tool but I wasn't able to derive lim d->1 T(d)=0 ?
Anyway, nice feature with the symbolic calculation in the tooltips!
Jakob
#7 Posted: 5/5/2009 6:48:00 AM
Hi Jakob,
thanks for the help.
I figured that out later, it was just a in the sample file - which I have made a bit simpler to show my problem a bit more clearly.
I have now added it, and it seem to work in deed. When writing T(value of d)= it gives a correct result.
That is the remaining problem. If one actually zooms in a lot, you can see, that it plots something, but since the values of d (x-axis) is extremely small - the plot is more or less useless.
I have uploaded the corrected file and you can find it under the link from my previous post. If anybody knows how to get a useful plot out of the data, my problems (for now) would be solved.
thanks for the help.
Wrote
1. you need to define n1
I figured that out later, it was just a in the sample file - which I have made a bit simpler to show my problem a bit more clearly.
Wrote
2. to make T vs d you have to use the following syntax: T(d)=...sinh(y(d)) ... I tried this and it worked.
I have now added it, and it seem to work in deed. When writing T(value of d)= it gives a correct result.
Wrote
3. The function you intend to plot leads to 1/infinity (since sinh of a huge number is more or less infinity), and as you defined d has to be something the size of 10^-7 to keep values of T in a reasonable order of magnitude. But there is currently no possibility to define the plot borders so, actually it is impossible to plot this function!
That is the remaining problem. If one actually zooms in a lot, you can see, that it plots something, but since the values of d (x-axis) is extremely small - the plot is more or less useless.
I have uploaded the corrected file and you can find it under the link from my previous post. If anybody knows how to get a useful plot out of the data, my problems (for now) would be solved.
1 Pages (8 items)
- New Posts
- No New Posts