1 Pages (6 items)
plot function - The derivative of a function does not appear - Messages
#1 Posted: 12/10/2019 10:32:25 AM
Hello everybody.
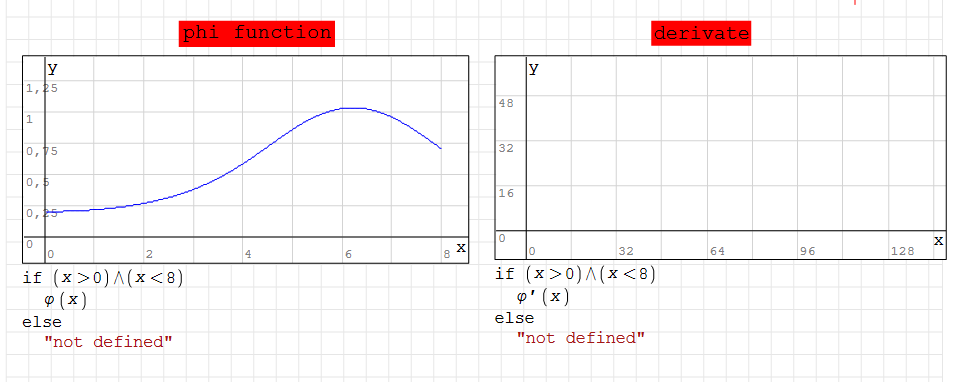
I can't understand why the phi function does not compare in the graph.
This function is the derivative of the phi function that instead appears in the graph.
Someone could help me please?
Thanks in advance
this is the file… Derivate.sm (22.19 KiB) downloaded 943 time(s).
I can't understand why the phi function does not compare in the graph.
This function is the derivative of the phi function that instead appears in the graph.
Someone could help me please?
Thanks in advance
this is the file… Derivate.sm (22.19 KiB) downloaded 943 time(s).
#2 Posted: 12/10/2019 12:31:00 PM
WroteI can't understand why the phi function does not compare in the graph.
This function is the derivative of the phi function that instead appears in the graph.
1. your φ(t) plots correct
2. The Smath derivative operator works on derivative rules.
3. The φ(t) is too much a monkey business for derivative rules.
4. Rescue via transit infinitesimal analysis.
5. Your constrain in plot argument is obsolete since if/otherwise
was introduced by Davide from f(x) menu "cases".
Derivate (1 doctored).sm (24.69 KiB) downloaded 968 time(s).
#3 Posted: 12/10/2019 2:36:26 PM
Thanks for the reply, I solved this problem.
Now, however, an error appears that does not make me draw a graph.
the error says: "The result is higher than the maximum positive value allowed"
what does it mean?
curvatura.sm (48.33 KiB) downloaded 989 time(s).
Now, however, an error appears that does not make me draw a graph.
the error says: "The result is higher than the maximum positive value allowed"
what does it mean?
curvatura.sm (48.33 KiB) downloaded 989 time(s).
#4 Posted: 12/10/2019 5:30:44 PM
WroteNow, however, an error appears that does not make me draw a graph.
the error says: "The result is higher than the maximum positive value allowed"
what does it mean?
... doctored version works top2bottom
1. Remember λ(x) as used
2. More problem(s) ... return the doctored version.
3. Delete all the black
curvatura (1 doctored).sm (53.54 KiB) downloaded 970 time(s).
#5 Posted: 12/10/2019 6:39:51 PM
WroteThanks for the reply, I solved this problem.
Now, however, an error appears that does not make me draw a graph.
the error says: "The result is higher than the maximum positive value allowed"
what does it mean?
curvatura.sm (48.33 KiB) downloaded 989 time(s).
Hi. Means that' you have divide by zero or something other invalid operation. You must to avoid that for plots with restrictions in the ranges, or with try ... on error in a routine for range plots. Attached have this second option.
curvatura - moto v2.sm (43.4 KiB) downloaded 908 time(s).
curvatura - moto v2.pdf (371.21 KiB) downloaded 652 time(s).
Best regards.
Alvaro.
1 users liked this post
sergio 12/11/2019 6:03:00 AM
#6 Posted: 12/11/2019 1:38:57 AM
This technique enable the view of symbolics.
curvatura - moto v3.pdf (460.93 KiB) downloaded 605 time(s).
curvatura - moto v3.sm (1.12 MiB) downloaded 989 time(s).
Best regards.
Alvaro.
curvatura - moto v3.pdf (460.93 KiB) downloaded 605 time(s).
curvatura - moto v3.sm (1.12 MiB) downloaded 989 time(s).
Best regards.
Alvaro.
1 users liked this post
sergio 12/11/2019 6:03:00 AM
1 Pages (6 items)
- New Posts
- No New Posts