1 Pages (11 items)
Functions not Plotting in Graph - Two functions will not plot. - Messages
#1 Posted: 10/9/2022 12:06:17 AM

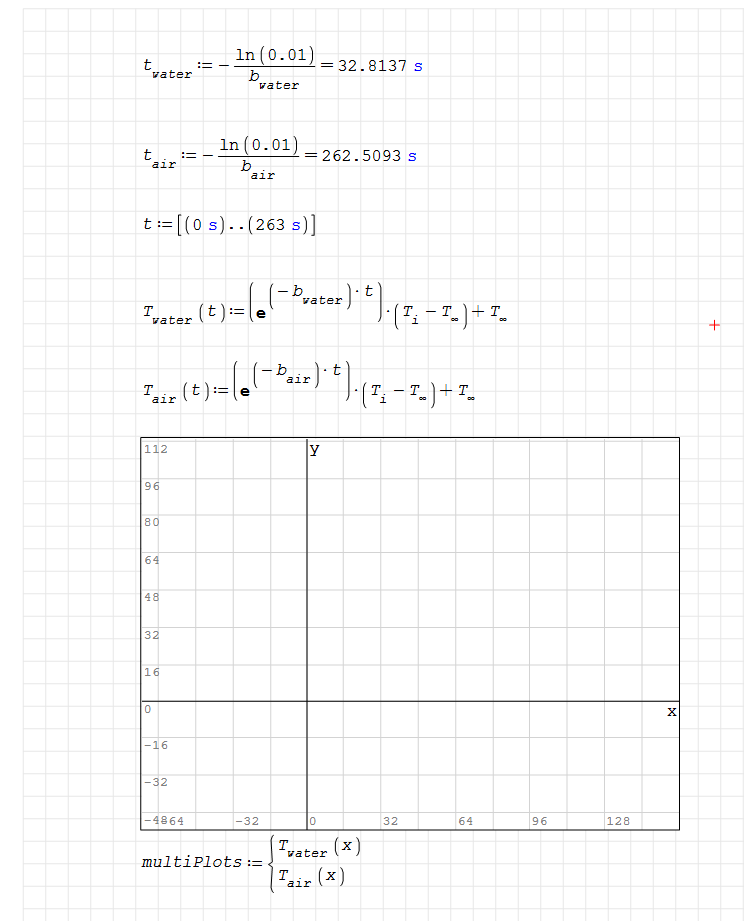
I am trying to plot two temperature curves governed by two equations with one variable that changes between them and one variable that goes from an interval of 0 seconds to 263 seconds. The plot window accepts the equations, but does not plot them. Additionally, when trying to get either equation to solve, it gives an error "cannot calculate". Which is quite odd, running through it on my calculator the equations work fine.
My only lead to what is going on, is perhaps the formatting is off and SMath doesn't understand it? I tried removing all the .waters and .airs, but that didn't work. I tried removing the time units, didn't work. Tried giving time just one value, did not work. I tried removing the (x) and (t) from the equation, did not work. I followed exactly what the wiki said to do, so I am not sure why I can't get these to plots. Don't really want to have to switch over to excel to get the graphs... Attached is a screenshot of the issue and the equations.
Anyone have any ideas?
#2 Posted: 10/9/2022 6:33:33 AM
Too many complains in there ...
better attach the *.sm document for doctoring.
Try this ...t(x):=-ln(0.01)/x ... plot
better attach the *.sm document for doctoring.
Try this ...t(x):=-ln(0.01)/x ... plot
#3 Posted: 10/9/2022 10:20:18 AM
Wrote
Anyone have any ideas?
Hi Albedo. Try to plot T(x*'s)
Best regards.
Alvaro.
#4 Posted: 10/9/2022 8:13:49 PM
WroteToo many complains in there ...
better attach the *.sm document for doctoring.
Try this ...t(x):=-ln(0.01)/x ... plot
WroteWrote
Anyone have any ideas?
Hi Albedo. Try to plot T(x*'s)
Best regards.
Alvaro.
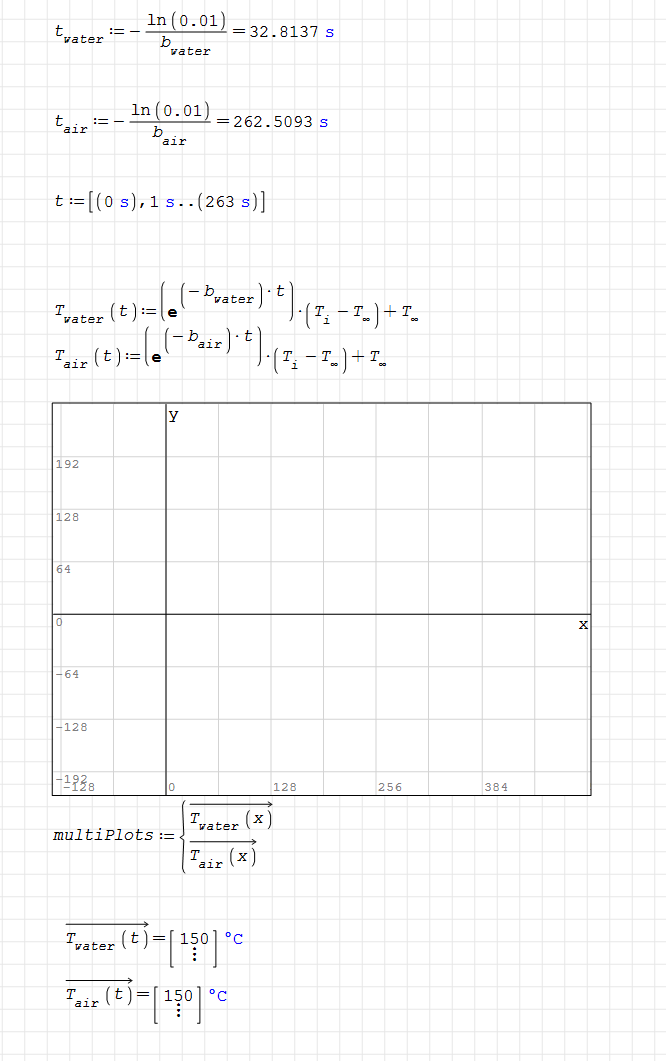
Tried to plot T(x*'s), no luck either. Attached is the .SM file if you want to try experimenting with it.Worksheet2.sm (7.81 KiB) downloaded 1077 time(s).
EDIT: Found a previous post of somebody struggling to get a range variable to calculate, the solution was to vectorize the equation after to get it to form a matrix. This works and gives me the correct temperature value, but it still will not plot the functions.
#5 Posted: 10/9/2022 11:42:40 PM
Wrote
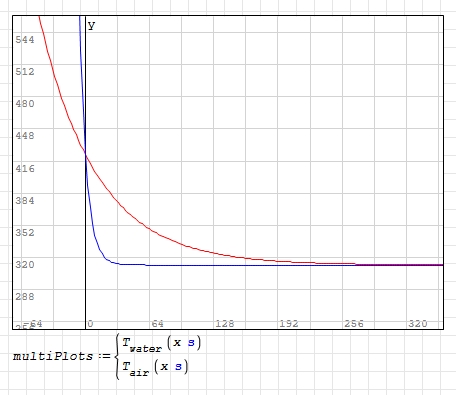
Tried to plot T(x*'s), no luck either. Attached is the .SM file if you want to try experimenting with it.
Hi. Try to resize the plot too.
Best regards.
Alvaro.
#6 Posted: 10/9/2022 11:56:50 PM
WroteWrote
Tried to plot T(x*'s), no luck either. Attached is the .SM file if you want to try experimenting with it.
Hi. Try to resize the plot too.
Best regards.
Alvaro.
Awesome, thanks! That is exactly what I wanted. One last thing, is there a way to change the units for the y-axis? It is in Kelvin but I may want to change it to degrees C instead.
#7 Posted: 10/10/2022 6:51:21 AM

WroteAwesome, thanks! That is exactly what I wanted. One last thing, is there a way to change the units for the y-axis? It is in Kelvin but I may want to change it to degrees C instead.
You have these options:
Manipulate units in plot definition
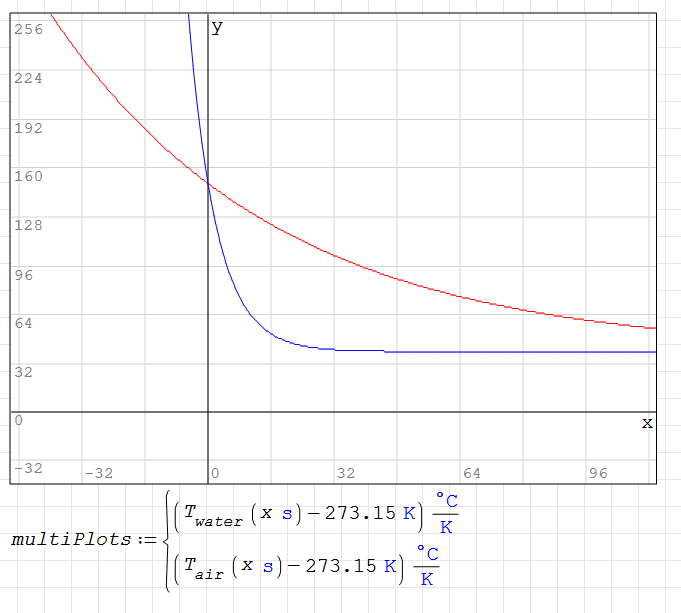
Or...manipulate units in the function definition:

Regards,
Oscar
#8 Posted: 10/10/2022 9:41:41 AM
... as interpreted to be commented.
Cheers ... Jean.
Worksheet2 as interpreted.sm (18.39 KiB) downloaded 1139 time(s).
Cheers ... Jean.
Worksheet2 as interpreted.sm (18.39 KiB) downloaded 1139 time(s).
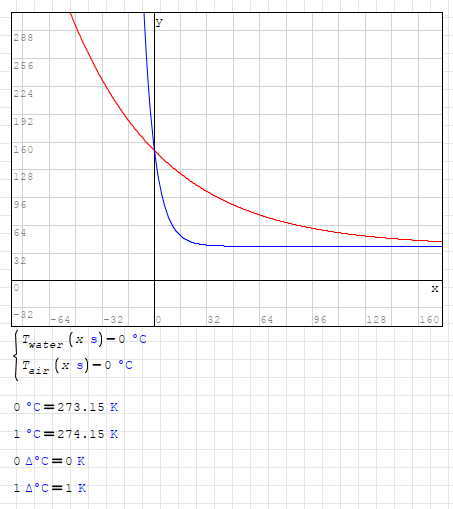
#9 Posted: 10/10/2022 5:06:00 PM
You can simply write as in plot below.
Just a reminder, since you are working with temperatures.
Temperature unit handling is different in SMath.
Addition of temperatures beside Kelvin should be done with delta units.
Otherwise, it will cause some unwanted complications.
Regards
Just a reminder, since you are working with temperatures.
Temperature unit handling is different in SMath.
Addition of temperatures beside Kelvin should be done with delta units.
Otherwise, it will cause some unwanted complications.
Regards
3 users liked this post
#10 Posted: 10/11/2022 9:02:31 AM
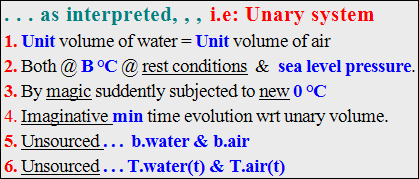
Wrote... as interpreted to be commented.
As given, your project is not traceable.
It may be correct, but not for publishing.
Cheers ... Jean ... welcome for more.
Worksheet2 as interpreted.sm (34.27 KiB) downloaded 1102 time(s).
#11 Posted: 10/12/2022 11:51:45 AM
... as it looks, Twater(t), Tair(t)
likely represent some experimental data set(s).
If so, don't hesitate to attach for a fitting session.
Of the 100's Smath fitting sessions ... NONE have resisted.
Cheers ... Jean ... maybe soon.
likely represent some experimental data set(s).
If so, don't hesitate to attach for a fitting session.
Of the 100's Smath fitting sessions ... NONE have resisted.
Cheers ... Jean ... maybe soon.
1 Pages (11 items)
- New Posts
- No New Posts