1 Pages (5 items)
[2D plot] Issue plotting points and functions together - Messages
#1 Posted: 11/16/2018 3:45:03 PM
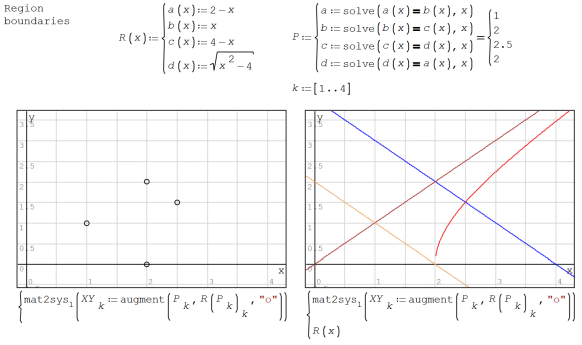
Hi. In the attached, can plot points and functions, but not both in the same plot.
Double Integral.sm (10.7 KiB) downloaded 1111 time(s).
Best regards.
Alvaro.
Double Integral.sm (10.7 KiB) downloaded 1111 time(s).
Best regards.
Alvaro.
#2 Posted: 11/16/2018 5:27:11 PM
WroteHi. In the attached, can plot points and functions, but not both in the same plot.
The old style works otherwise.
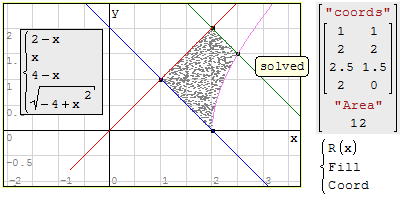
You can fill the region of integration.
Cheers ... Jean
Double Integral.sm (16.39 KiB) downloaded 1104 time(s).
Double Integral FillRegion.sm (17.83 KiB) downloaded 1069 time(s).
#3 Posted: 11/17/2018 6:40:28 AM
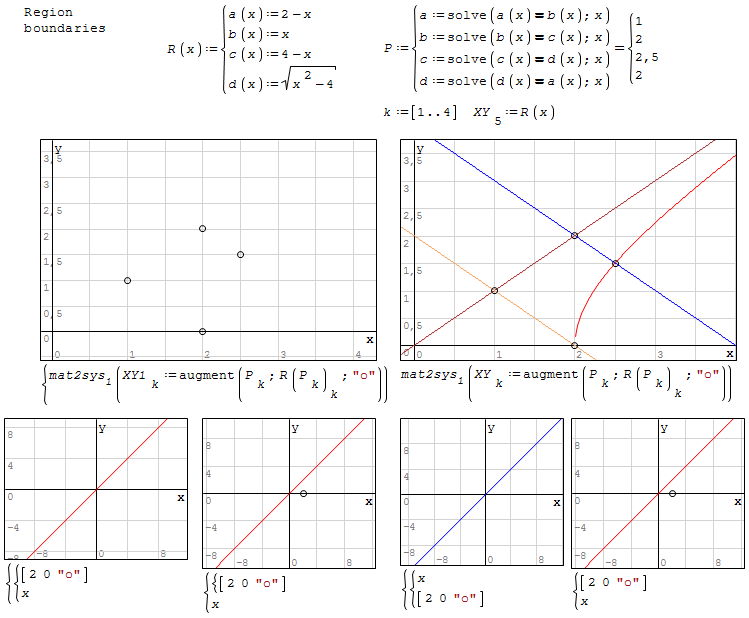
The behaviour of arguments in nested lists seems to be unpredictable, at least I don't see the rule.
Thus, re-arranging objects works but I don't know why.
Double%20Integral_Kr.sm (11.48 KiB) downloaded 1230 time(s).
Thus, re-arranging objects works but I don't know why.
Double%20Integral_Kr.sm (11.48 KiB) downloaded 1230 time(s).
Technische Mechanik mit SMath Studio: https://link.springer.com/book/10.1007/978-3-658-50592-9
1 users liked this post
Alvaro 11/17/2018 11:17:00 AM
#4 Posted: 11/17/2018 11:46:20 AM
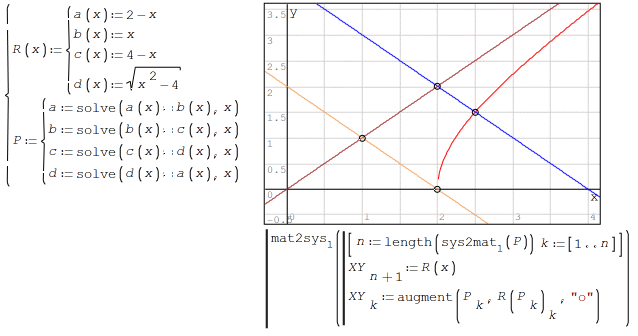
Hi Martin. Thanks for the tip. I guess that I take this form, from you suggestion:
Best regards.
Alvaro.
Best regards.
Alvaro.
#5 Posted: 11/17/2018 6:18:39 PM
WroteHi Martin. Thanks for the tip. I guess that I take this form, from you suggestion:
... personally: I prefer the more conventional form.
The example in view may fail in other instance(s).
3 in one: functions, solutions, fill-in region.
X_Y Plot wisely [Solve] Boundary.sm (39.51 KiB) downloaded 960 time(s).
1 Pages (5 items)
- New Posts
- No New Posts