Help with continuousfunctions - heating and cooling curves - Messages
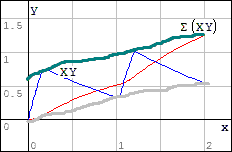
I need a little help with the following. I got the heating and cooling curves of an motor (see Picture1)
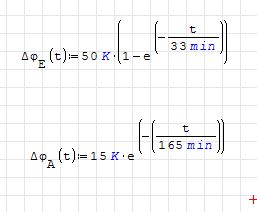
The Motor will heat up for 10min and then cool down for 50min. This over a specific time period, in the example 2 times. ->120min
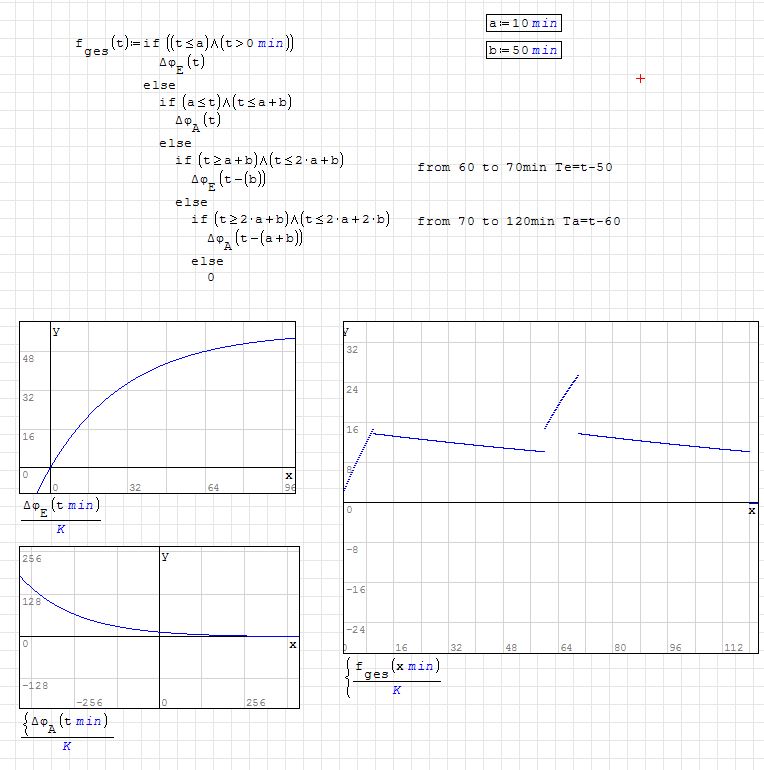
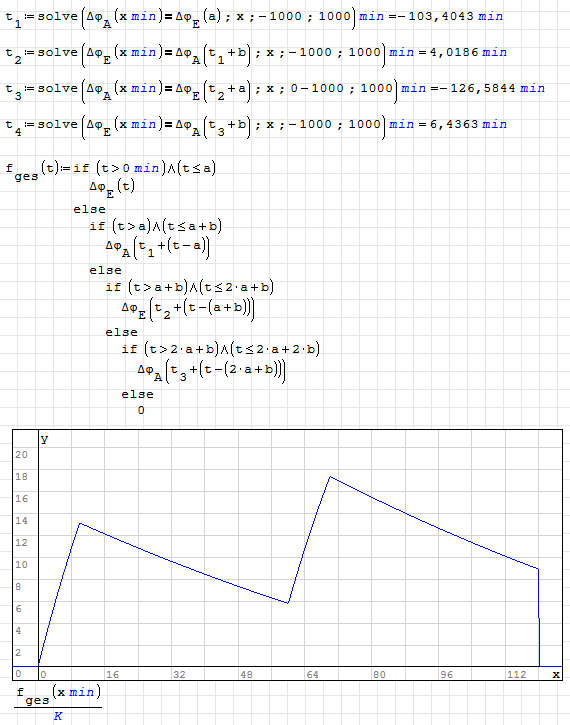
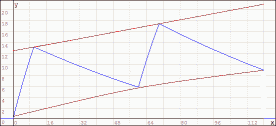
I tried to tie the functions together with the boolean Algebra as a continuous function. It works somehow but I do not get the solution I want to get..The do not connect since the second heating curve starts where the first stopped, not at the cooling curve(Picture 2)
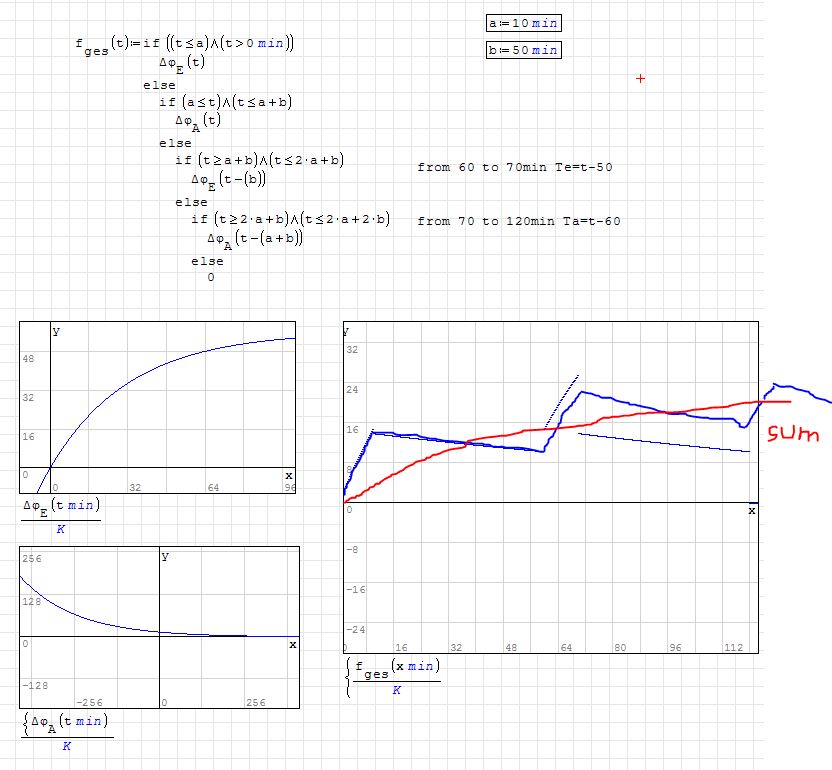
Where I am trying to get to is shown in Picture3 (blue graph).
Furthermore I would like to Display a "sum"function in the graph. (Picture3) I have not thought about it yet but I do not think it is this easy with continuous functions. It won't be e.g. h(x)=f(x)*g(x)

Thank you!
Mark
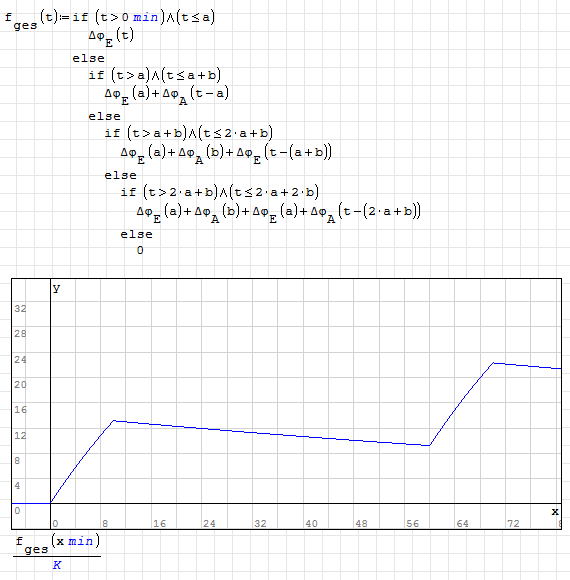
Actually, the resulting equation shouldn't operate times, but end temperatures of previous operation, to work as expected. My variant just literally fixes your implementation, but is physically incorrect.
Here's the one that's correct:
1. The function you have collected from "if(s)" .... fges
Discretize in the range of interest.
2. Pass it to the "Finite Differences Integrator"
3. The accuracy of FDI is considered exact.
4. Discretise fine enough, lot of points,
check the changes in the last result.
Attched work sheet should help.
Jean
Integrate Discontinuous.sm (25.46 KiB) downloaded 1027 time(s).
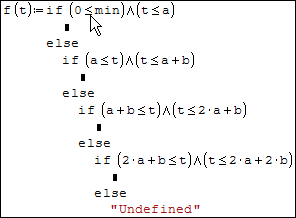
in your "if(s)", many conditions are incompletely defined
<, > make them all complete ...the other one "greater/smaller or equal"
Jean
Wrote... it seems it won't work, why ?
in your "if(s)", many conditions are incompletely defined
<, > make them all complete ...the other one "greater/smaller or equal"
I'm not sure I understand your point... sorry English is not my native tongue. Could you please clarify?
If you mean that threr are points there uncovered by the function due to improper use of /<=/>=, then could you please name one such point?
fails, apply the suggested change. If you have difficulties
to complete your project, please attach the work sheet.
Jean
of proportion because it is based on your image, digitised.
The general look will not change from the real project.
Jean
Therefore, CAS have no units. CAS units are "CAS units" ... They can be "UnitGraphic"
"Unit Result" . For instance: this project runs over 2 hr on the graph, if the
'hr' is the project unit system, then in Smath it is 2. The magnitude of the graph
in unit ... is not anything .... its unit is "1" . All that considered, you can visualise
the cumulative integral over the discontinuous integrand , after that append the unit system.
... Export the project in "UserUnit" or "ProjectUnit"
View the project.
Cheers, Jean
first of all, thank you very much for the help with this. It seemed that I was on the right path but somehow (I think lack of Programm knowledge) could not finish alone...
Jean: I am struggling with the sum function. Is your "sum-sign" from a plug-in? Because this is not the normal Sum-sign. Can this be done without any plugins?
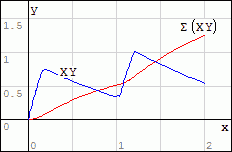
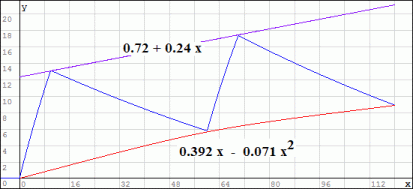
And is it possible to get not just the red curve but also the upper border curve (green) and lower border curve (grey)? Because this would be my final Goal

Thank you Jean and Mike
Best regards
Mark
WroteJean: I am struggling with the sum function. Is your "sum-sign" from a plug-in? Because this is not the normal Sum-sign. Can this be done without any plugins?
And is it possible to get not just the red curve but also the upper border curve (green) and lower border curve (grey)? Because this would be my final Goal
________________"Sum-sign"________________
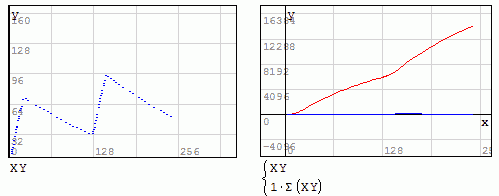
Is your own expresion. The red curve is the "Cumulative Integral"
i.e: the progressive area under the curve, in your case under the
discontinuous zigzag. Easy to draw upper/lower bounds on your plot
1. collect the two XY coordinates of the upper border
add the linterp plot.
2. Collect the 3 points coordinates of the lower border,
There will be 4 alternatives:
a/. Smath built-in "ainterp" spline.
b/. Smath built-in "cinterp" spline
c/. From the 3 points coordinates pass a 2nd order polynomial
This last one is from little program tool utility.
d/. It's possible to pass a Bézier curve as well.
The two borders in the attached are drawn in Paint,
"upper" is a straight line, lower is Bézier Paint tool.
No shame to attach your work sheet... do you fly by yourself
or board on an airplane ? I guess the answer !
Guess the best: once in hand the straigth line function and
the curved function, you will be able to hatch the region
from Martin "hatch utility tool", wouldn't it be nice ?
Jean
Jean
Digitise Model Tutor.sm (35.76 KiB) downloaded 1022 time(s).
Jean
WroteI noticed you have a plot. In case the finite differences
fails, apply the suggested change. If you have difficulties
to complete your project, please attach the work sheet.
Jean
 I see. You use inclusive brackets universally. As I understand it, it's for cases where the graph has "jumps" - non-contiguous. In this case, the template you suggest helps analyser to understand each segments' left and right limits.
Probably that's unnecessary for those where each segment starts precisely where previous ends, but your template won't hurt here anyway.
WroteProbably that's unnecessary for those where each segment starts precisely where previous ends, but your template won't hurt here anyway.
***************************
That's what Smath, Mathcad ,,, want "precisely" when dealing with discontinuous functions.
Up until now, I found only De Boor that wants "precisely unprecisely".
That is determined by the basic algorithm, not from individual whish.
Jean
WroteWrote
No shame to attach your work sheet... do you fly by yourself
or board on an airplane ? I guess the answer !
Hello,
as you predicted...
So I attached the worksheet. The thing I did not clear at first that there are some more Parameters (eg the 50K and the 33min).
First off all I tried out the "cinter"-function (cause when you do more than 2 if Loops it is not a linear function anymore). And I am trying to get a solution.
But I think I need your help here, furthermore I think it is a challenge for you,too.
Since the function has Parameters how can I determine the X and Y coordinates to put them into the "cinter" function.
thanks!
Mark
Edit: Furthermore the a/c-inter-functions cannot be displayed while using the f.ges function....?
Smath_studio_curves.sm (54.88 KiB) downloaded 1089 time(s).
ainterp, cinterp are cubic spline "Interpolators".
You don't see the difference in this example,
in other instances: they are much different.
The collapsed area is quite a big "Monkey business" !
I have something much more technical but not yet in Smath.
Wiil work on that, but not today.
Jean
Forum curves.sm (60.61 KiB) downloaded 1085 time(s).
thank you for your time and support for this topic.
yeah I thought that my problem is not that simple cause of the discontinuous function....
I figured out that the inter-functions have differences, but I think that is not the point.
Do you know why I can't place the a/c-inter into the same diagramm as the "f.ges"? For a first example I have made some points by eye, but it always says that the first variable (e.g. cinter( X;Y;x) is not defined...
best regards
Mark
WroteDo you know why I can't place the a/c-inter into the same diagramm as the "f.ges"?
The 3 Smath interpolators are discrete: linterp, ainterp, cinterp
NOT "inter" ==> "interp"
Your fges(t) is scalar in 't'. Smath does not plot mixed scalar and discrete,
to avoid ambiguity. In this case, you would have to discretise both
fges(t) and cinterp(X,Y,t). I'm working on your project [indirectly] because
I need it in Smath but this time correct that you can adapt to your case study.
Cheers MarkZ
Jean
The theoretical shape of the ramps up/down would
turn out a "monkey business for the birds". It
was attempted in Mathcad, not to avail edu. The
linear ramps are as demonstrative.
Cheers MarkZ, enjoy.
Jean
Inst_Control ON_OFF.sm (94.05 KiB) downloaded 1040 time(s).
- New Posts
- No New Posts