[2d Plot] Axis limits - Plots do not fit axes to data, so data are not visible. - Messages
Plots do not fit axes to data, so data are not visible. (win and cloud version)
As far as I can see there only seems to be mouse wheel scaling.
Mouse wheel scaling is not working (v6622 win10) ctrl-scroll scales whole ui, regardless of clicking on graph. (Plot toolbar buttons do nothing)
As data has values in the 20000 range, mouse wheel scrolling out to fit the data is useless.
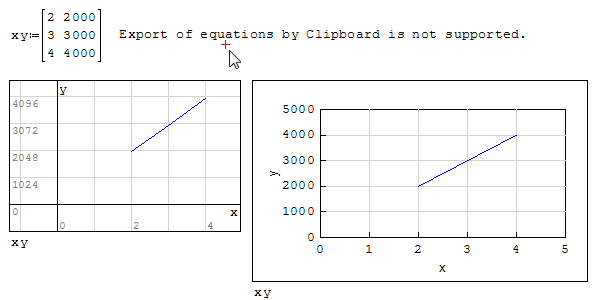
Obviously also no good to scale x,y same if x=2,3,4 y=2000,3000,4000
Since graph needs to change the fit when the data changes, it must be automatic, again manual mouse wheel scaling is not useful
Example https://en.smath.info/cloud/worksheet/yvgUuxnR
What I see (cloud or studio)

Blog search is your friend
ctrl mouse wheel = zoom whole page
shift mouse wheel = pan l-r
Regardless, I expect that the plot would show the data i.e autoscale to begin with. Otherwise it seems to be just dead. It should not require googling anything for the data to be visible.
Similarly the graph must still show data, when the source data changes - it can't just vanish off the plot.
Which is exactly why the users won't use it: "can't make graphs work"
[FYI - I am trying to get school kids doing technology, to measure thermistor resistance vs temperature, plot it, and calculate voltages.
This is exactly what Mathcad was good for (when it was affordable)
Currently they can't get step 2: Plot data.
(And they are having problems with step 1: enter array data , which is to do with the editmode insert/append being non-obvious, and illegible on arrays, even for those who understand what is going on)
]
WroteI am plotting arrays of data.
Plots do not fit axes to data, so data are not visible
Please, attach the document
Wrote[FYI - I am trying to get school kids doing technology, to measure thermistor resistance vs temperature, plot it, and calculate voltages.
This is exactly what Mathcad was good for (when it was affordable)
Currently they can't get step2: Plot data.
The attached document is quite advanced, just for didactic.
In Process Control & Instrumentation, we don't use Thermistors.
They are inaccurate, unstable ... reserved for motor protection
and many more common gadgets [home thermometers, car ...]
If you measure Ω, you must measure °C simultaneously
so to collect the data set to plot. No voltage is involved.
Make sure you use a Pro enough Ωmeter, as well reliable °C.
If your data set makes some sense [at least 10 pairs] and
if you wish more about, attach the the data set, more can be done
to enrich your project. Don't attempt Thiele, it's another stuff.
Inst_Thermistor.sm (854.72 KiB) downloaded 1459 time(s).
Don't really agree. I would say PT100/1000 thermistors would be the most common industrial sensors I have seen.
I am still re-calibrating Philips PTC silicon thermistors in a telemetry system, made in 1994. Of the 100 or so still in service, none have detectable drift. (as an aside, the generation of fixed point binary polynomials with truncation optimised fitting, was done in Mathcad)
High beta NTC thermistors had the best resolution, accuracy, heat-injection, thermal leakage, and the lowest noise by a couple of orders of magnitude when I worked with ultra precision sensing. Not so good when hit with a hammer, I will grant...
WroteDon't really agree. I would say PT100/1000 thermistors would be the most common industrial sensors I have seen.
I am still re-calibrating Philips PTC silicon thermistors in a telemetry system, made in 1994. Of the 100 or so still in service, none have detectable drift. (as an aside, the generation of fixed point binary polynomials with truncation optimised fitting, was done in Mathcad)
High beta NTC thermistors had the best resolution, accuracy, heat-injection, thermal leakage, and the lowest noise by a couple of orders of magnitude when I worked with ultra precision sensing. Not so good when hit with a hammer, I will grant...
=============================================
Your question was about plotting pairs of data, do you agree it works ?
No matter the "grand Savants" measuring temperature, they will never do exactly.
That beautiful note:
"On ne pourra jamais déclarer les Wr du thermomètre théorique à résistance de platine;
d'une part inférant à l'incertitude des mesures, d'autre part concluant le canevas
résolvant. En d'autres mots: les Wr ne pourront que refléter la coïncidence résolvante.
Dans les faits, le thermomètre théorique à résistance de platine n'existe pas par
privation de la nature de se reproduire elle-même exactement et infiniment au grès de
la transformation de l'homme. La nature ne donne le platine que sous forme de pépite
ou par extraction. Le Créateur a donné la température [état et sensation physique]
mais pas le thermomètre."
What about Experimental Quantic Computers that must operate @ max 0.02°C from absolute ?
The three attached documents concern industrial temperature measurements.
Types J, T were developed at time of Mathcad DAEP [Jean & Robert]
NI [National Instruments] were delighted of the method as I could see their next
Mathcad based Technology.
The Platinum Pt 100 exists nowhere else than in this Smath document.
The method to the coefficients is secret to only myself. I doubt it could be
reproduced in Smath [didn't attempt].
The previous Thermistor exercise is a piece cake. Some "Cryogenic sensors"
are nearly discontinuous, we fit a model via 'linfitCheby' piece of cake for Smath.
Please, don't hesitate to attach your raw data pairs ... from lab, school ...
Inst_Type T Copy.sm (52.34 KiB) downloaded 1339 time(s).
Inst_Type Pt100 Copy.sm (58.39 KiB) downloaded 1328 time(s).
Inst_Type J Copy.sm (111.04 KiB) downloaded 1384 time(s).
Anyway, back on topic.
In my sample, the data is not visible on the graph.
https://en.smath.info/cloud/worksheet/yvgUuxnR
WroteI can't begin to imagine using thermocouples to measure near absolute zero....
The T & J documents show how to personalize T/C.
In their specified range, they are sensibly as accurate as Pt 100,
providing extension wiring is not too many km long.
Export of equations by Clipboard is not supported.
That one is so short, OK ... much longer => don't open.
WroteNot sure if you mean that it works for you, or have you done something to get it to scale the axes.
X_Y plot => you set the x, y limits
the QuickPlot => you wheel/mouse/zoom the x, y
Shift wheel mouse for the x
Ctrl wheel mouse for the y
click in plot shift up/dn, left/right to move the plot.
I can't see any way to set plot limits.
and no, it doesn't seem to scale by mouse (but it has in the past, however that was not useful as there is such a long way from 8 to 8000, that mouse scaling is just silly.
On my system:
ctrl mouse wheel = zoom whole page
shift mouse wheel = pan l-r
I guess the answer is it doesn't autoscale to fit.
I agree, an auto zoom to the correct plot area would be nice

WroteI agree, an auto zoom to the correct plot area would be nice
Smath default QuickPlot [Shift+@] is same as Mathcad [± 10]
For Smath auto-zoom it would need the XY plot arguments
independent, same style as Mathcad. Even then, you have
to set each direction wrt to the data.
- there is no X-Y plugin in cloud version
- the plot can't be scaled, because those commands are applied to the webpage not the graph
(Luckily that doesn't really matter when you can't insert a matrix of data either....)
An autozoom is not *nice*, it is the minimum acceptable level of functionality for this to be working.
Today I am looking for a tool that provides an easy way for noobs to do a very simple task: enter a small set of data, and plot it.
SM should be that tool. Especially with a cloud version.
SM is currently incapable of doing this.
If I were to suggest "You can just get it going by multiplying by 10^-8 then labelling the axes", they would (rightly) think I was barking mad.
Needing to install a plugin to get the most basic graph to work is similarly just crazy, as is "Just keep turning the mouse wheel until eventually you can see something"


P.S. since the main topic is not a bug but a missing feature, post moved to feature requests section.
btw trying to import your tex output to Lyx at the moment....
WroteToday I am looking for a tool that provides an easy way for noobs
to do a very simple task: enter a small set of data, and plot it.
How can it be simpler than actually ?
Plug your argument [here matrix], click in the plot, rotate wheel mouse <=,=>
Your specific request: Plenty of gadgets for noobs, why an Smath for noobs ?
Not as easy as it looks, like this ... try from free web gadgets.
If you read my input here, you see that I have stated several times that the MOUSE WHEEL DOES NOT ZOOM.
Secondly, if it does work, it is not really very user-friendly when you have to zoom and zoom and zoom and zoom to get out far enough to see 120000.
You ask "How can it be simpler than actually?" Well if it just showed the damn data on the graph that would be simpler!
Thirdly, when the axes have disparate values (X=[2,3],Y=[120000,13000]) zooming doesn't get a useful result
Fourth. I think SMATH is an awesome tool for noobs. It *should* be fantastic for year 10/11 schoolchildren. It *should* be the first choice for manipulating and graphing data in science and technology class. It should be joining maths class to computing and science classes by having the mathematical worksheet view, rather than the programming centric c/java/matlab approach. Excel should be the last and never choice. I will make a feature request about this - I think that small effort on the UI for schoolkids and noobs, will have 100x the total impact, new users, and return on effort, that improving it for power users. As an side effect it will make things better for all users. Easier to use has few drawbacks.
- New Posts
- No New Posts