1 Pages (10 items)
Thermal stresses in a pipe - wrong results - Messages
#1 Posted: 4/12/2021 8:19:12 AM
Hi,
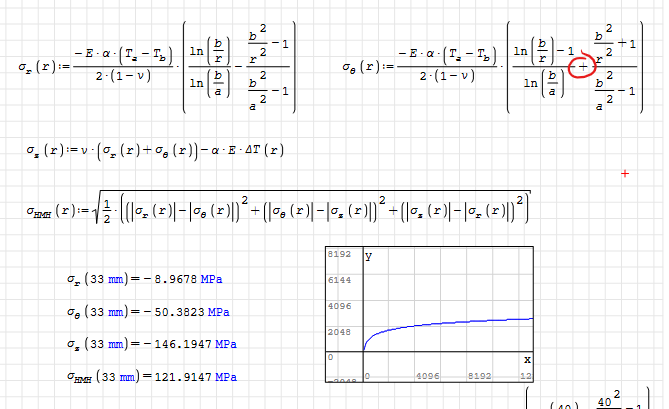
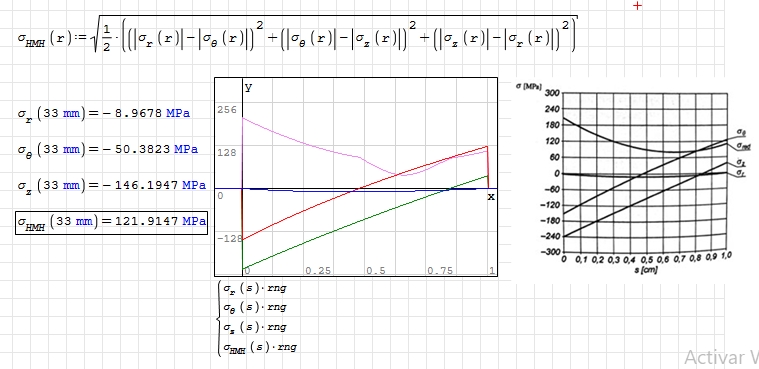
I am trying to calculate the values of thermal stresses (radial σ_r, tangential σ_θ, axial σ_z and von Mises σ_HMH) for a thick-walled pipe subjected to temperature gradient (higher temperature T_a on inner wall and lower temperature T_b on outer wall). I am looking for the variation of these stresses through the thickness of the pipe. I've found proper equations for that in a book and I've already tested them. The problem is that in SMath I am getting wrong values of σ_θ and thus also σ_z and σ_HMH. When I check these equations for r=33 mm, only the radial stress σ_r is correct (I know the right values because I have reference solutions from a book and from Excel). The equations for σ_r and σ_θ are almost identical (there are just two small differences) so I don't know what can be wrong here. According to Excel, for r=33 mm the results should be:
σ_r = -8,968 MPa (only this one is correct in SMath)
σ_θ = -50,382 MPa
σ_z = -146,195 MPa
σ_HMH = 121,915 MPa
And that also agrees with the plot I have from a book.
I couldn't find any error in my calculations. Myabe you will notice something.
Of course I've also attached the sm file: Thick-walled pipe thermal stress.sm (96.43 KiB) downloaded 912 time(s).
#2 Posted: 4/12/2021 10:02:22 AM
Please note that I am not aware of the correct formula at all, I have just played with numbers...
Since you expect this numerical result:
you will get them placing a "+" instead of "-"
Please double-check with your reference book, and check back excel file used for comparison, too..
Please note that I also switched to delta_t units, but it is not affecting the calculated values based on how formulae are written
Bye
Since you expect this numerical result:
WroteHi,
According to Excel, for r=33 mm the results should be:
σ_r = -8,968 MPa (only this one is correct in SMath)
σ_θ = -50,382 MPa
σ_z = -146,195 MPa
σ_HMH = 121,915 MPa
you will get them placing a "+" instead of "-"
Please double-check with your reference book, and check back excel file used for comparison, too..
Please note that I also switched to delta_t units, but it is not affecting the calculated values based on how formulae are written
Bye
1 users liked this post
EngMath 5/30/2021 9:00:00 AM
#3 Posted: 4/12/2021 10:04:02 AM

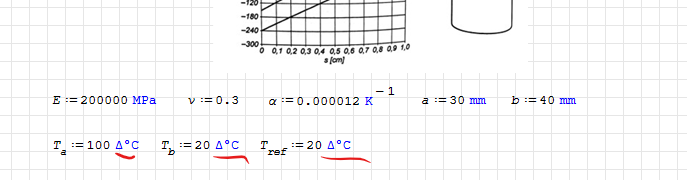
Places where T.a, T.b and T.ref are used cannot be calculated correctly because you are using nonlinear units there.
#4 Posted: 4/12/2021 10:25:05 AM
Thank you very much for replies. Apparently the discrepancy in results was caused by the fact that I forgot about this third difference between the equation for σ_r and the one for σ_θ (+ instead of - between the two major fractions in the second term of the equation). This was included in Excel and now the results from SMath agree with reference solutions.
However, I’m a bit surprised that you say it can’t work with units. After this small change everything works fine even when units are included. When it comes to ΔT, it’s meant to be used just like a symbol (similar to σ_r), not some additional operation. Maybe I should use Δ_T, T_Δ or other variation instead, but again - it seems that everything works fine now.
By the way, do I have to substitute all values to each equation to create plots ? Can’t they use variables assigned before ?
Ok, apparently I can plot using σ_r(x) and so on only without units. I’d prefer to stick with units though since they are one of the greatest advantahes of SMath.
#5 Posted: 4/12/2021 10:50:10 AM
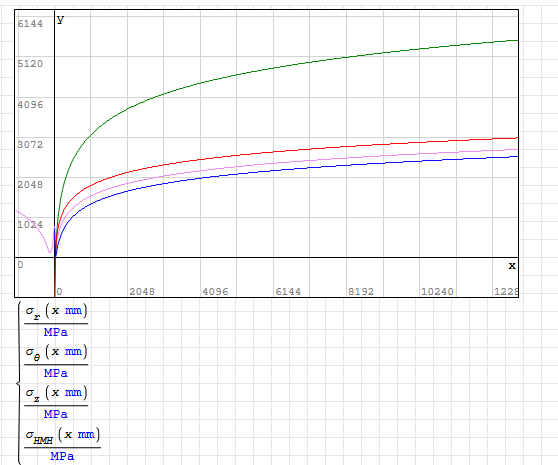
You can plot even if everything before has units, just give a proper unit of measurement to generic "x" placeholder and then divide the result by the unit of measure that "scales" Y-axis as desired.
So, in the following graph x-axis is [mm], y-axis is [MPa]
Better to see the example than read this in a sentence
Thick-walled pipe thermal stress_plot.sm (98.07 KiB) downloaded 997 time(s).
So, in the following graph x-axis is [mm], y-axis is [MPa]
Better to see the example than read this in a sentence
Thick-walled pipe thermal stress_plot.sm (98.07 KiB) downloaded 997 time(s).
1 users liked this post
EngMath 5/30/2021 9:00:00 AM
#6 Posted: 4/12/2021 11:08:30 AM
Thanks again. But how did you type this ? SMath doesn’t allow me to enter units for x if I type (x ’mm).
Also, all the plots of these functions generated by SMath (whether units are used or not) look completly different than in the book (as you can see in a picture attached to my first post here) and in Excel. Maybe that’s because of the large values on both axes. Zooming closer takes ages since SMath has to recalculate. Is there a way to set range for x axis (so that I can see the curves starting from x=30 to x=40) ?
Also, all the plots of these functions generated by SMath (whether units are used or not) look completly different than in the book (as you can see in a picture attached to my first post here) and in Excel. Maybe that’s because of the large values on both axes. Zooming closer takes ages since SMath has to recalculate. Is there a way to set range for x axis (so that I can see the curves starting from x=30 to x=40) ?
#7 Posted: 4/12/2021 11:15:47 AM
x * mm to insert units
I cannot comment on the correctness of equations above and graphs, as I said before I was just playing with numbers when I noticed that switching "+" to "-" was the cause of result mismatch between your mentioned excel file and your smath uploaded file.
In any case, the picture is a plot against "s" (thickness of the pipe), while if I understood correctly you wanted to plot sigma against "x" (a radius in your equations).
Different plots with different meanings? Again, better to check the book than to speculate too much.
In case you want to zoom in the graph to check details at lower scales, better to turn-off automatic calculation feature in Smath, and refresh results once you have set the graph scale as desired.
Other methods are available with x-y plot plugin (super-useful, in case take a look at the forum page dedicated to this plugin)
#8 Posted: 4/12/2021 11:27:16 AM
Yes, the plot should be for s understood as r from 30 to 40. Zooming in with mouse wheel doesn’t help - y axis adjusts but x axis remains at very hight values.
Do you mean the X-Y Plot Region plugin ? I’ll definitely give it a try.
Do you mean the X-Y Plot Region plugin ? I’ll definitely give it a try.
#9 Posted: 4/12/2021 12:14:38 PM
WroteIs there a way to set range for x axis (so that I can see the curves starting from x=30 to x=40) ?
... like this two ways plot.
Thick-walled pipe thermal stress_plot.sm (182.52 KiB) downloaded 997 time(s).
#10 Posted: 4/12/2021 2:24:39 PM
WroteYes, the plot should be for s understood as r from 30 to 40.
So, s=a+x*(b-a) and it is restricted by the range rng=lele(s,a,b ) / 'MPa . Just include the scale factor MPa here for comfortability.
WroteZooming in with mouse wheel doesn’t help - y axis adjusts but x axis remains at very hight values.
Use Ctrl-wheel for zoom only y-axis and Shift-wheel for x-axis.
I modify your von Mises stress formula for yielding taking out abs values, so for r=33 mm it gets σ.HMH(33*'mm)=140.3168@'MPa. But with this modification plots looks very similar now:
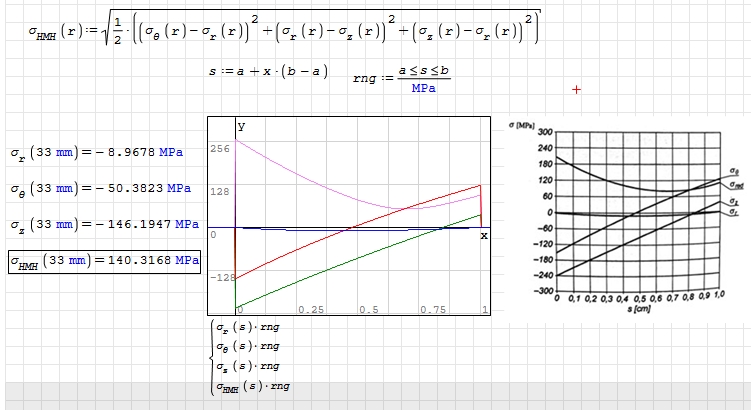
With the abs values it have some erratic behavior:
Best regards.
Alvaro.
1 Pages (10 items)
- New Posts
- No New Posts