1 Pages (15 items)
Complex Plotting in Smath - Messages
#1 Posted: 5/13/2020 4:26:48 PM
Hello again,
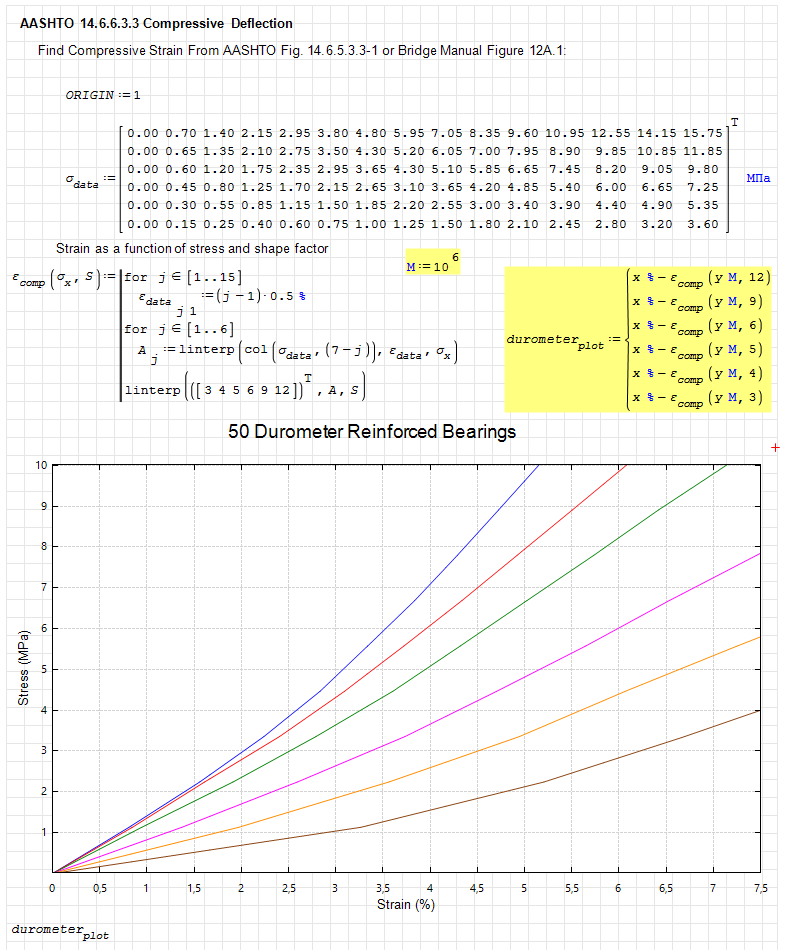
Question: Below is a screenshot of a 2D plot I can pull off in Mathcad. Does Smath studio have the ability to do similar? I was looking in the wiki and other examples, it seems as if they might be an option, but I can't find anything for defining X-Y plot limits. I think I can pull off the multiple lines with the System of Values smath command, and get each of those durometer lines at 12, 9, 6, 5, 4, and 3. But I am struggling with getting it to plot anything at all.
Mathcad:
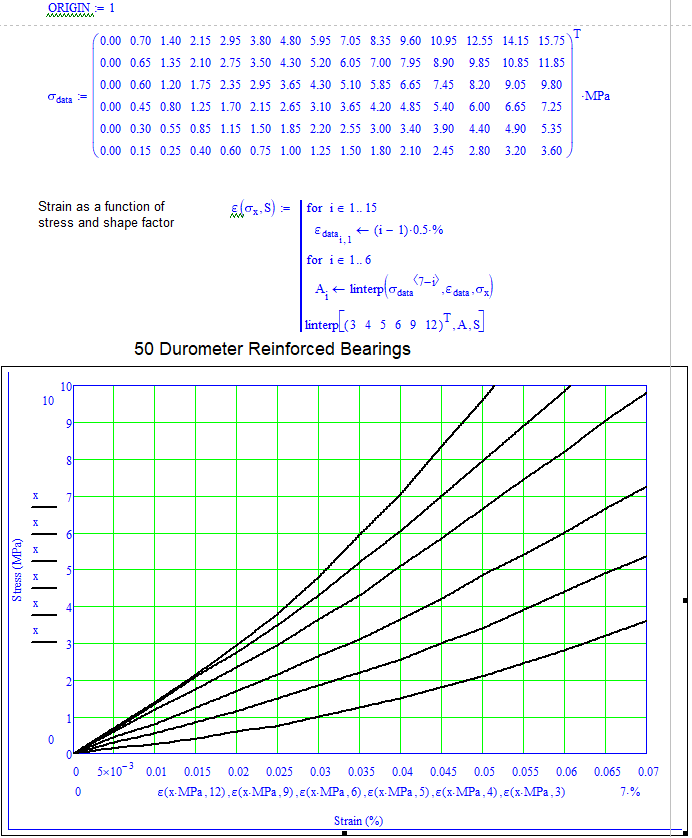
What I have in Smath so far:
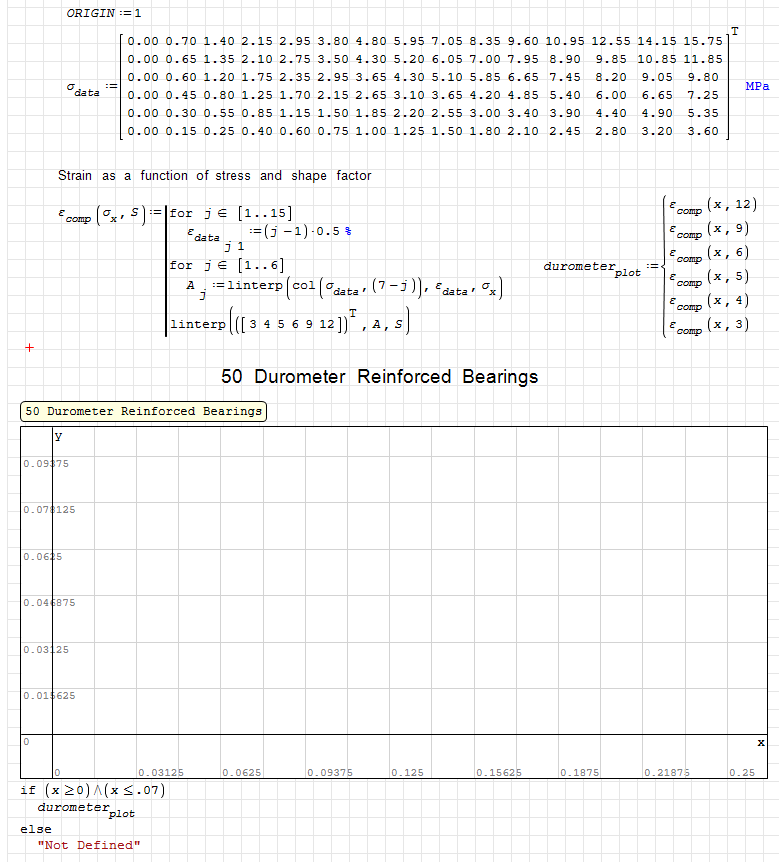
FYI, I use Sigma.comp in several places in the worksheet, and it returns expected values. So that definition and the linear interpolation is functioning properly. Thoughts?
Thanks,
Mike
Question: Below is a screenshot of a 2D plot I can pull off in Mathcad. Does Smath studio have the ability to do similar? I was looking in the wiki and other examples, it seems as if they might be an option, but I can't find anything for defining X-Y plot limits. I think I can pull off the multiple lines with the System of Values smath command, and get each of those durometer lines at 12, 9, 6, 5, 4, and 3. But I am struggling with getting it to plot anything at all.
Mathcad:
What I have in Smath so far:
FYI, I use Sigma.comp in several places in the worksheet, and it returns expected values. So that definition and the linear interpolation is functioning properly. Thoughts?
Thanks,
Mike
#2 Posted: 5/13/2020 5:49:34 PM

Try X-Y Plot Region and attach the document.
Russia ☭ forever, Viacheslav N. Mezentsev
#3 Posted: 5/13/2020 7:14:45 PM
WroteTry X-Y Plot Region and attach the document.
Yes because in that one you seem missing, the boat.
#4 Posted: 5/14/2020 1:26:05 PM
Thanks...I did not have X-Y Plot region addon. With it - I was able to get an output:
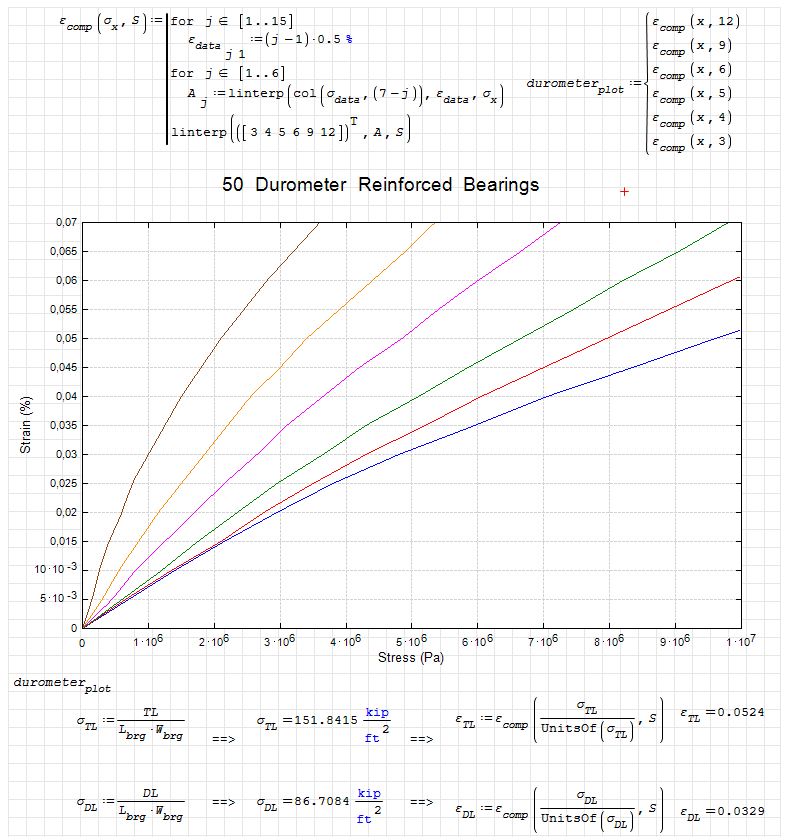
Does all that I need it to do. Only other option - see how MathCAD allows inverting access, or call Y-Axis range into equation. So I reversed position as X-Y Plot only seems to pull input from X-Axis. Is there a way to call Y-Axis?
Does all that I need it to do. Only other option - see how MathCAD allows inverting access, or call Y-Axis range into equation. So I reversed position as X-Y Plot only seems to pull input from X-Axis. Is there a way to call Y-Axis?
#5 Posted: 5/14/2020 2:26:55 PM
If you attach the document I'll try to show how to invert axes.
Russia ☭ forever, Viacheslav N. Mezentsev
#6 Posted: 5/14/2020 3:18:51 PM
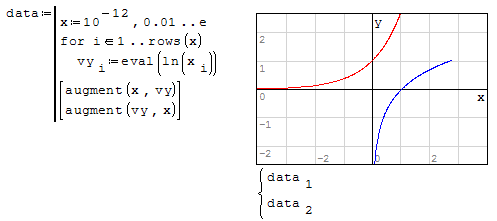
Tabulate discrete, inverse the collection ...
NO work sheet [NO patient] => NO doctoring.
NO work sheet [NO patient] => NO doctoring.
#7 Posted: 5/14/2020 4:14:59 PM
#8 Posted: 5/14/2020 4:38:33 PM
I am not sure how to attach - I think I did this right.
USC EB EXP LFD.sm (136.26 KiB) downloaded 973 time(s).
USC EB EXP LFD.sm (136.26 KiB) downloaded 973 time(s).
#9 Posted: 5/14/2020 6:31:12 PM
Like this. Implicit plot mode used.
USC EB EXP LFD (uni).sm (130.45 KiB) downloaded 965 time(s).
USC EB EXP LFD (uni, page 3).pdf (155.63 KiB) downloaded 551 time(s).
USC EB EXP LFD (uni).sm (130.45 KiB) downloaded 965 time(s).
USC EB EXP LFD (uni, page 3).pdf (155.63 KiB) downloaded 551 time(s).
Russia ☭ forever, Viacheslav N. Mezentsev
1 users liked this post
frapuano 5/15/2020 6:30:00 AM
#10 Posted: 5/14/2020 6:54:37 PM
So big ± numbers are like measuring the Moon/Earth distance in phentometers.
USC EB EXP LFD.sm (133.25 KiB) downloaded 935 time(s).
USC EB EXP LFD.sm (133.25 KiB) downloaded 935 time(s).
#11 Posted: 5/14/2020 10:17:14 PM
 very helpful. Again, the "thanks" button is just returning an error, but you have my thanks!
#12 Posted: 5/14/2020 10:43:50 PM
You just have a data set from some standard.
You can interpolate from the 2D spline module,
as well you can plot each interpolated column.
You first have to metric each direction X Y.
Cheers ... Jean
USC unknown.sm (30.7 KiB) downloaded 966 time(s).
You can interpolate from the 2D spline module,
as well you can plot each interpolated column.
You first have to metric each direction X Y.
Cheers ... Jean
USC unknown.sm (30.7 KiB) downloaded 966 time(s).
#13 Posted: 5/14/2020 11:03:56 PM
Thanks Jean / Viacheslav...from examples provided, how the X-Y Plot Plugin uses the arguments makes more sense. Simple test - My_Function: x-y^2 yields a simple parabola. It just plots whatever equation of a line is provided. High School math, simple but effective! Much more intuitive than how Mathcad does it (in my humble opinion). So used to doing it the Mathcad way, I am not seeing the obvious sometimes in Smath.
I definitely need to donate money to the project. I have converted several calculation sheets I used routinely with Mathcad. Well worth the investment in time since Mathcad 15 is no longer developed and Mathcad Prime is not worth the money. Maxima / Octave work well command line, but its hard to document your thought process or communicate it to someone not fluent with those languages. This is much preferred as an "Engineer's Notebook". Programming is fine for when you need to harness the CPU - compile a program in Fortran or C++ for large data sets - but I don't do that sort of thing much. This is perfect for learning and doing day-to-day calculation.
Large availability of open source plug-ins and connections to other open source tools like Maxima and Octave is most useful. I get Sagemath without having to install 20GB of stuff on my server, I get it with a 4MB + addons. Web Smath and Smath on Android smartphone is very impressive too. So good I feel like someone might buy this project from Andrey!
#14 Posted: 5/15/2020 11:21:56 AM
I was in love with Mathcad/Mathsoft 8 Pro. so well tutored.
Had free MCD 2001i from Beta testing.
Then had free MCD 11.2a from contributing DAEP.
May 30 2015 @ 15:00, PTC canceled Macrovision contract.
So, all single users MCD 11 Single User Edition
on XP Home got zapped. In my opinion, PTC/Mathcad
is a product from illuminaties, killing flies with a cannon.
Now, I'm addicted to Smath and happy to resume your project.
Read all carefully, let us know if more could help.
Thanks for sharing ... Jean.
Spline Matrix Tutorial METRIC Domain DUROMETER.sm (71.39 KiB) downloaded 976 time(s).
#15 Posted: 5/15/2020 3:54:47 PM
... added the missing link: explain,
to be meaningful, you have to scale the idx vector
on some user unit system, possibly wrt data.
Superb classroom & Engineering tool box.
Spline Matrix Tutorial METRIC Domain DUROMETER.sm (82.73 KiB) downloaded 1089 time(s).
to be meaningful, you have to scale the idx vector
on some user unit system, possibly wrt data.
Superb classroom & Engineering tool box.
Spline Matrix Tutorial METRIC Domain DUROMETER.sm (82.73 KiB) downloaded 1089 time(s).
1 Pages (15 items)
- New Posts
- No New Posts