1 Pages (10 items)
Histogram Program - Messages
#1 Posted: 1/11/2019 5:41:50 PM
File not found.File not found.
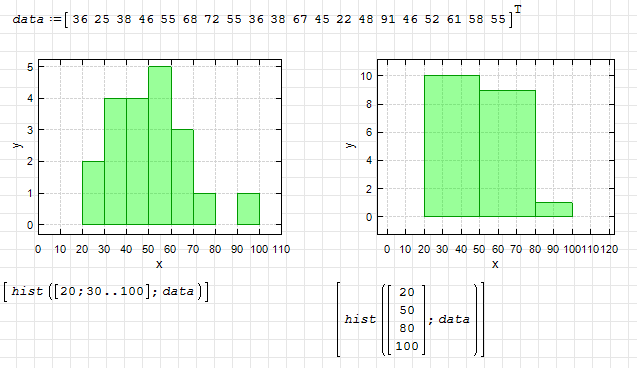
I've come across a mathcad2000i worksheet that I converted to prime4, the attached pdf shows the results. I've attempted to reproduce the Histogram(X) routine in SMath but can't seem to get past the "Argument must be a vector..." error. I welcome the collabs review and recommendations if this routine will work.
Thank you,
#2 Posted: 1/12/2019 3:12:54 AM
Hi. Do you have the original Mathcad2000 worksheet?
Instead of parse a variable parameter number f(x,p1,p2,p3,...) you can use just f(x,p) but with p as a vector columns. With that you don't need replicate, Vec2Vec&Size and the other similar utilities.
Best regards.
Alvaro.
Instead of parse a variable parameter number f(x,p1,p2,p3,...) you can use just f(x,p) but with p as a vector columns. With that you don't need replicate, Vec2Vec&Size and the other similar utilities.
Best regards.
Alvaro.
#3 Posted: 1/12/2019 7:47:15 AM

If you like my plugins please consider to support the program buying a license; for personal contributions to me: paypal.me/dcprojects
1 users liked this post
frapuano 1/12/2019 8:33:00 AM
#4 Posted: 1/12/2019 11:30:09 AM
WroteI've come across a mathcad2000i worksheet that I converted to prime4, the attached pdf shows the results. I've attempted to reproduce the Histogram(X) routine in SMath but can't seem to get past the "Argument must be a vector..." error. I welcome the collabs review and recommendations if this routine will work.
I think, don't understand what you are trying to do ... few points:
1. NaN what introduce by Mathsoft during design of DAEP [2003]
2. NaN is not ∞ ... rather it is based on floating point error,
a pure decoration in Smath except if related to Maple.
3. Tom G. didn't have DAEP [300 $ in 2003]. Tom did lot of work based on NaN.
From recollection, he used ^307. I tried simulate NaN in Smath not to avail.4
4. In Mathcad, there are 17 styles random, all built-in from the universal
random uniform found in most systems.
5. 'rlogis' is useful in Monte-Carlo stuff, included in the attached.
6. Also attached: how to simulate normal random from the CLT
Central Limit Theorem.
7. If you are given a data set that looks bell shape, trying to fit that is
like lottery ... Why ?
8. Data are just data, they don't collect bell shape by themselves.
Some smart have binned them. Depending upon the binning you will get
all sorts of misleading PDF.
9. Added the PW weighted histogram c/w the original application that lasted
weeks that the originator had none of "thanks or equivalent" in his vocabulary.
Cheers ... Jean
Stat Monte Carlo [rlogis].sm (74.59 KiB) downloaded 866 time(s).
Stat Random normal USER.sm (123.34 KiB) downloaded 976 time(s).
Stat Histogram PW.sm (110.69 KiB) downloaded 1000 time(s).
#5 Posted: 1/12/2019 11:45:31 AM
WroteI welcome the collabs review
... Oh ! forgot to return your original
Probability Fitting[1].sm (90.65 KiB) downloaded 772 time(s).
#6 Posted: 1/12/2019 2:20:25 PM
Prob Fitting.xmcd (182.44 KiB) downloaded 1083 time(s).
Thank you, David & Jean for your help and direction.
Alvaro, for your reference, attached is the worksheet, I believe by Tom Gutman.
Again, many thanks!
Thank you, David & Jean for your help and direction.
Alvaro, for your reference, attached is the worksheet, I believe by Tom Gutman.
Again, many thanks!
#7 Posted: 1/12/2019 2:30:37 PM
WroteI believe by Tom Gutman
Yes, Tom Gutman
This demo to illustrate the CLT
Stat Histogram DEMO.sm (23.33 KiB) downloaded 1004 time(s).
#8 Posted: 1/12/2019 9:33:48 PM
See Maxima docs for available functions and options
![2019-01-13 01_24_47-SMath Studio 0.99.6884 - [Streuung.sm].png](/en-US/files/Download/urKVug/2019-01-13-01_24_47-SMath-Studio-0.99.6884---[Streuung.sm].png)
Streuung.sm (45.46 KiB) downloaded 1043 time(s).
streug.rar (291 B) downloaded 278 time(s).
Streuung.sm (45.46 KiB) downloaded 1043 time(s).
streug.rar (291 B) downloaded 278 time(s).
Technische Mechanik mit SMath Studio: https://link.springer.com/book/10.1007/978-3-658-50592-9
1 users liked this post
frapuano 1/13/2019 5:20:00 AM
#9 Posted: 1/13/2019 8:48:58 PM
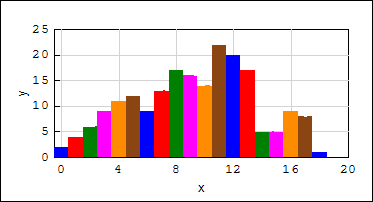
WroteThis demo to illustrate the CLT
From native Smath, you can have:
1. colors at will [rich from X_Y plot], even white to imitate no bar.
2. Slightly separated, joined, slightly overlapped.
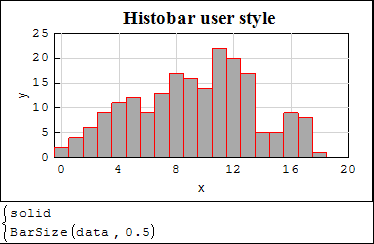
3. solid or hatched at will.
Stat Histogram BarColor.sm (26.33 KiB) downloaded 1015 time(s).
#10 Posted: 1/14/2019 12:48:22 AM
... or like this.
1 Pages (10 items)
- New Posts
- No New Posts