1 Pages (15 items)
Basic Graphics - The augment function maybe not working on Linux - Messages
#1 Posted: 3/29/2023 2:41:21 PM
Hi,
I installed Smath Studio from the AUR repository, I am using Arch and the installation went fine.
I am reading the document GraficasBasicas2012.pdf, which I downloaded from the Wiki Tutorials.
The problem is that the function augment(1,2,3) works different under Linux, and I cannot figure out how to make a simple graphic as the one in the adjointed file.
graficos_prueba.sm (9.46 KiB) downloaded 1351 time(s).
Maybe someone could help me, regards.
#2 Posted: 3/29/2023 3:59:11 PM
Hi,
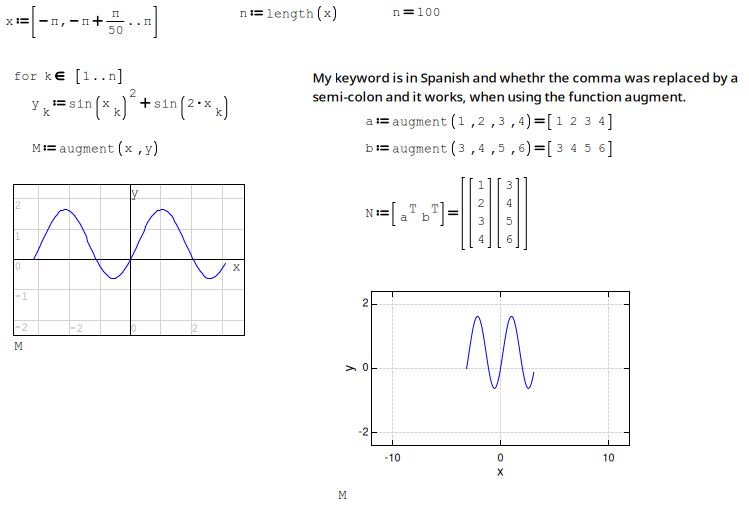
In the Tools->Options Section I could change the semicolon <;> and now I use the comma (,) as separator. Now I can use the function augment with comma (,) but the graphic function is still not working.
I wonder whether someone can give me a hint.
Regards,
In the Tools->Options Section I could change the semicolon <;> and now I use the comma (,) as separator. Now I can use the function augment with comma (,) but the graphic function is still not working.
I wonder whether someone can give me a hint.
Regards,
#3 Posted: 3/30/2023 8:09:11 AM
... fast, perfect meshing 'x'.
#4 Posted: 3/30/2023 10:21:48 AM
Hi Jean,
Tank you for the post, he problem was solved using the pallete. I will mark as solved.
Regards,
Tank you for the post, he problem was solved using the pallete. I will mark as solved.
Regards,
#5 Posted: 3/30/2023 11:34:39 AM
WroteHi Jean,
Tank you for the post, he problem was solved using the palette.
I will mark as solved.
NO Javier, NOT solved.
Your 'x' is improperly meshed.
#6 Posted: 3/30/2023 12:16:30 PM
Hi Jean,
I can reproduce your example without any problem, I cannot understand where the parameters H,N and L are defined. Also, you defined a function xd and used to evaluate x. Why I cannot use range?.
I suppose that is there an useful explanation for this, which I am curious about it. Maybe, you can give me some hint?
Regards,
#7 Posted: 3/30/2023 1:09:12 PM
WroteHi Jean,
I can reproduce your example without any problem, I cannot understand where the parameters H,N and L are defined. Also, you defined a function xd and used to evaluate x. Why I cannot use range?.
I suppose that is there an useful explanation for this, which I am curious about it. Maybe, you can give me some hint?
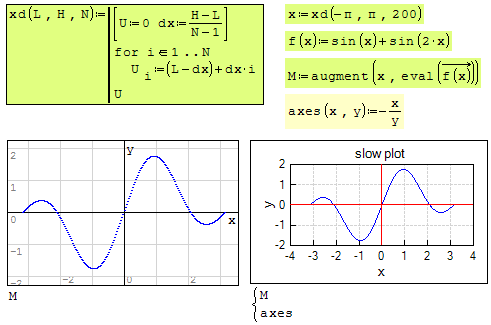
[L,H,N] are defined in x:= xd(L,H,N)
Why I cannot use range ?.
If you use range, 'x' will start -pi
but will never exactly terminate +pi
unless N in range is 15 decimals ... totally foolish.
Your graph does not terminate +pi.
xd discretizer will populate exactly any 'N' ± pi.
Cheers ... Jean.
#8 Posted: 3/30/2023 3:28:21 PM
#9 Posted: 3/30/2023 4:22:54 PM
Hi Jean,
I am greatly surprised with your answer.
I will take care of this lesson in future calculations.
Thanks in advance,
I am greatly surprised with your answer.
I will take care of this lesson in future calculations.
Thanks in advance,
#10 Posted: 3/30/2023 9:49:26 PM
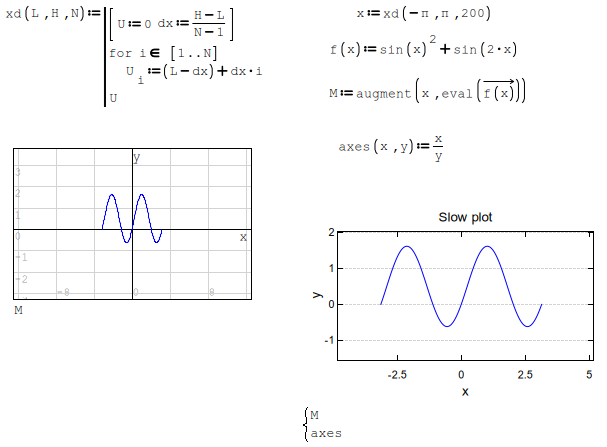
If your purpose is plotting a range, this is the way.
This is most suitable for your type of functions.
No mumbo jumbo, no algorithm, no unnecessary coding.
Only pure simple if block.
Regards
graficos_prueba1.sm (11.05 KiB) downloaded 1340 time(s).
This is most suitable for your type of functions.
No mumbo jumbo, no algorithm, no unnecessary coding.
Only pure simple if block.
Regards
graficos_prueba1.sm (11.05 KiB) downloaded 1340 time(s).
1 users liked this post
sergio 3/31/2023 10:20:00 AM
#11 Posted: 3/31/2023 9:40:31 AM
Hi Overlord,
I very appreciate your thoughts, the graphics looks pretty good.
Kind regards
I very appreciate your thoughts, the graphics looks pretty good.
Kind regards
#12 Posted: 3/31/2023 10:55:57 AM
WroteHi Jean,
I am greatly surprised with your answer.
I will take care of this lesson in future calculations.
Thanks in advance,
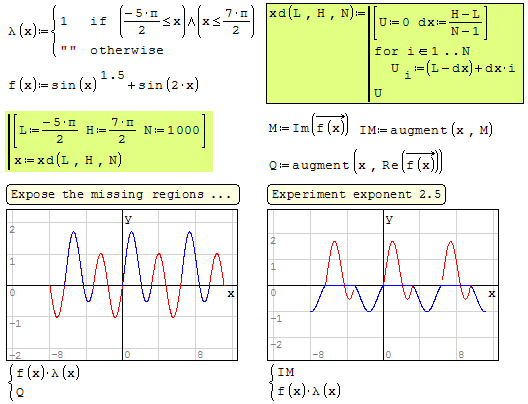
The all thing is to complete a project, mostly export.
See the missing regions ...
Please, don't hesitate ... Jean.
Javier More.sm (9.5 KiB) downloaded 1382 time(s).
#13 Posted: 3/31/2023 11:05:02 AM
Hi Jean,
This file is showing the origin of some missing parameters, like H,L,N, thank you for this worksheet.
I have a BSc in chemical engineering and a PhD in Industrial Chemistry, I also work in a biotechnology institute since 2003.
Maybe, this is why I was asking so many questions.
Kind regards,
This file is showing the origin of some missing parameters, like H,L,N, thank you for this worksheet.
I have a BSc in chemical engineering and a PhD in Industrial Chemistry, I also work in a biotechnology institute since 2003.
Maybe, this is why I was asking so many questions.
Kind regards,
#14 Posted: 3/31/2023 8:27:42 PM
WroteThis file is showing the origin of some missing parameters, like H,L,N, thank you for this worksheet.
You are not used yet to Smath algorithmic construction
Eager to assist your ChemEng projects.
Cheers ... Jean
#15 Posted: 4/1/2023 10:20:34 AM
WroteThis file is showing the origin of some missing parameters, like H,L,N, thank you for this worksheet.
To fully understand the command line algorithmic construction,
revisit this 4 examples document. Cheers ... Jean
Solve(f,q,x0,x1,TOL).sm (54.65 KiB) downloaded 1340 time(s).
1 Pages (15 items)
- New Posts
- No New Posts