ploting function that has the summation sign in it.

ploting function that has the summation sign in it. - ploting function that has the summation sign in it. - Messages

#1 Posted: 8/11/2023 3:47:51 PM
Pe1bjt

Pe1bjt

0 likes in 1 posts.

Group: User

Hi guys,

I'm trying to plot a function that has the sigma operator in it.
I'm unable to do it with Smath.
I made a worksheet to demonstrate this issue.
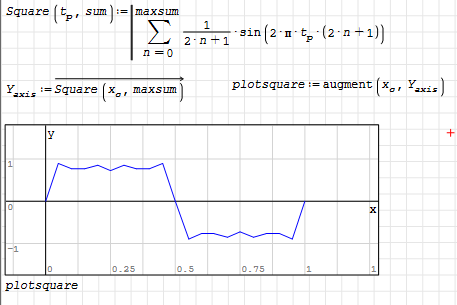
It is a simple example that plots a square wave as function of the harmonics added to a sinusoidal wave.
First part is to show I plot a sinus function, which works just fine.
However when I try the square wave function with the summation operator in the function I does not work that way.
What I'm I doing wrong?

See attachment.square_wave.sm (9 KiB) downloaded 30 time(s).

Please help.
Best regards Sonya
#2 Posted: 8/11/2023 4:26:31 PM
Alvaro Diaz Falconi

Alvaro Diaz Falconi

992 likes in 1674 posts.

Group: User

Hi. You are not doing nothing wrong, just SMath sometimes requires for some functions the line() instruction as a wrapper for delay de evaluations. And I don't know a general rule for that.

square_wave.sm (7 KiB) downloaded 43 time(s).

Clipboard01.png

Best regards.
Alvaro.
1 users liked this post
sergio 8/12/2023 8:02:00 AM
#3 Posted: 8/12/2023 10:18:38 AM
Jean Giraud

Jean Giraud

983 likes in 6866 posts.

Group: User

Wrote

What I'm I doing wrong ?


Indirectly, the argument of Sum is over the vector xc.
If you vectorize that argument, no need local definition
Mesh finer xc for higher maximum.
By same token, your system is ordinary Fourier.
You may want experiment Fourier/Fejer/Lanczos.
Please, confirm it works.
Cheers ... Jean.

Fourier Fejer Lanczos.sm (11 KiB) downloaded 40 time(s).

  • New Posts New Posts
  • No New Posts No New Posts