Create Callout function using "polyline" shape from UNI XY Plot region - Messages
It cames after several weeks of analyzing the history of the development of the XY Plot plugin from UNI; all this in the hope of understanding better how to use it and to minimize the possibility to get lost in the examples that I see recently published in the forum .
During the development of this small program there have been several issues to address and strange behaviours ( at least for me ) that have experienced but this will be the subject of a future mail (probably).
In the attached file have summarized many info's too distribuited in the posts and in the Martin's Reference Book so there is a little bit of documentation redundancy and I apologize in advance for this.
Moreover during the usage of the Shape functions I have had the illusion to understand something and I have written this down in some comments , I will be more than pleased if you can correct them if you feel that some of them are not correct .
The aim is always that of learning something more every day so thanks in advance for this .
There is however one thing that make me wonder and I would like to ask to UNI or anyone that is able to answer and is why it is not possible to place the output of a Shape function in the XY Plot placeholder directly but it is needed to place it in a (double ?) nested matrix otherwise the XY Plot Interpreter ( sorry fot the inappropriate name of the routine that I guess parse the string(s) of command written there ) is not able to understand correctly the plot request.
Best regards
Franco
XYPlot_Draw shapes Callout_.sm (202.85 KiB) downloaded 1476 time(s).

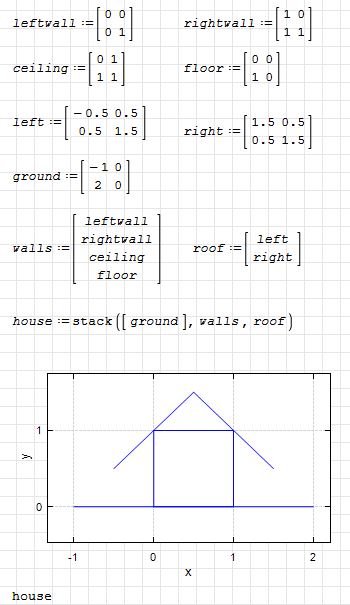
The usual nested poly line is similarly arranged, you can set several coordinate sets in the form of one nested matrix.
Many users do not use the grouping of sets from many shapes, so it is not clear to them why so many nested matrices.
An additional reason is to simplify the analysis of different data formats for the component. Data formats should not intersect during interpretation, causing ambiguity.
You can offer your own format, but you should think about how to maintain all other capabilities of the component.
I am accustomed to the equation list= someting with curly bracket at the beginning , so I have erroneusly thought to something else for what concern the shape routine/function input structure.
I'll study better Martin's Reference book about the list topic and hopefully will understand better what is explained in your post.
Thanks again and keep up the good work.
Best Regards
Franco
P.S. Off-Topic question , but why all the avatar pictures have disappeared , exept a few ones ? and it is not possible to restore them back.
WroteP.S. Off-Topic question , but why all the avatar pictures have disappeared , exept a few ones ? and it is not possible to restore them back.
I don't manage this. Only Andrey can tell what happened. Most likely some forum engine updates.
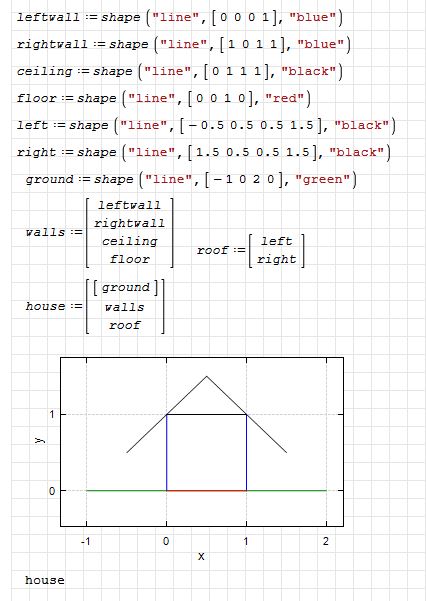
xyplot-polyline-house.sm (8.37 KiB) downloaded 1336 time(s).
xyplot-shapes-house.sm (11.72 KiB) downloaded 1382 time(s).
Best Regards
Franco
I am going ahead with the routine to draw a Callout and I have developed in the meantime a small function for the word wrapping of a long text stringXYPlot Word Wrap Tests.sm (21.4 KiB) downloaded 1376 time(s).
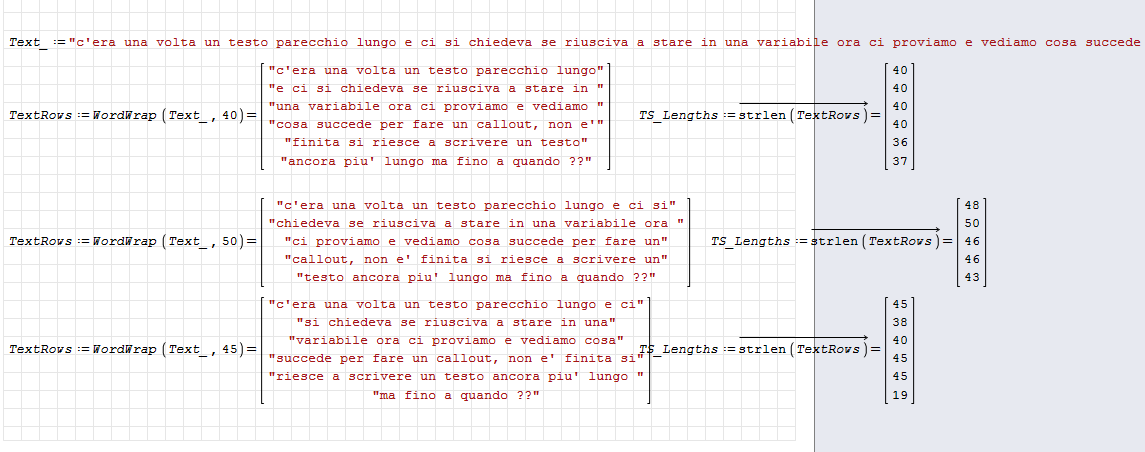
Now I would like to merge this function with the other one that draw the Callout arrow but to accomplish this I need to position vertically the substrings of text that are the output of the WordWrap function; so come out quite naturally the following questions:
1-When you define that the font of a text label is Arial10pt what does it means as a vertical dimension and which is the vertical and horizontal dimension of a letter Arial10pt
2-Which is the relationship - if exists - of the previous vertical dimension with the numbers that I use to specify the position of the label on the xy plane of a plot ( the coordinates where I place the text label) , Is it something with similar units ( which units? )
In the event of having these information probably I'll be able to position the substring of text correctly in the xy plane avoiding their overlapping and moreover I'll be able to evaluate the maximum horizontal length of each substring and define a correct size for a rectangle that will be the border of all the Callout text.
I hope that I was able to explain my concerns and that someone will have suggestions about the points above reported.
Thanks in advance to anyone and best regards
Franco
The ability to display text was added by analogy with the built-in component and I will not expand this function any further to maintain compatibility. There are already some differences in drawing that I need to fix.
Make me worry that it is not available for each font and specified size something that gives the max space as horizontal and vertical dimensions that any character that belongs to it can use , so that a rough estimate of the space occupied by a text string is possible.
Don't know if something empirical can be understood/developed with tons of trial and errors.
Moreover if I understand correctly there will be no possibility in the future to address the issue of the zooming of the text labels in a XY plot drawing for compatibility reasons.
Thanks a lot for your feedback and take care, Best regards,
Franco

WroteUni , I don't need an exact formula even if there is a rough extimation in excess it is ok .
Make me worry that it is not available for each font and specified size something that gives the max space as horizontal and vertical dimensions that any character that belongs to it can use , so that a rough estimate of the space occupied by a text string is possible.
Don't know if something empirical can be understood/developed with tons of trial and errors.
Moreover if I understand correctly there will be no possibility in the future to address the issue of the zooming of the text labels in a XY plot drawing for compatibility reasons.
Thanks a lot for your feedback and take care, Best regards,
Franco
I think you proposes is the way in which text is rendered on CAD software. So the text is converted to lines and splines and displayed on screen. In this way, this post is the most similar to that procedure.
I need to study it in detail because due to my ignorance I do not undertand the whole method ( even if looks to me that he transit trough the creation of an image of what need to be typed on the plot and images are zoomable in XY Plot so this is a workaround to the zooming problem that we are trying to address) .
My original desire was to create callauts just with one font to semplify the project and I like a lot the Arial one ..but I don't know how to create a Arial Monospaced font with the Alvaro's method so I will try to use the Franklin font that is however a clean and elegant one and see if I am able to merge it in the other funtions that I have tried to develop by myself.
Best regards
Franco
WroteYes Oscar, I was thinking about what was shown in the Alvaro's post but now in this last post of him here (Alvaro is really a force of nature ) there is another approach with some monospaced bitmap font scalable .
I need to study it in detail because due to my ignorance I do not undertand the whole method ( even if looks to me that he transit trough the creation of an image of what need to be typed on the plot and images are zoomable in XY Plot so this is a workaround to the zooming problem that we are trying to address) .
My original desire was to create callauts just with one font to semplify the project and I like a lot the Arial one ..but I don't know how to create a Arial Monospaced font with the Alvaro's method so I will try to use the Franklin font that is however a clean and elegant one and see if I am able to merge it in the other funtions that I have tried to develop by myself.
Best regards
Franco
You need to create a BMP with the characters of your font. Look that this BMP must be 225x121 pixels (for compatibility with Alvaro's script)
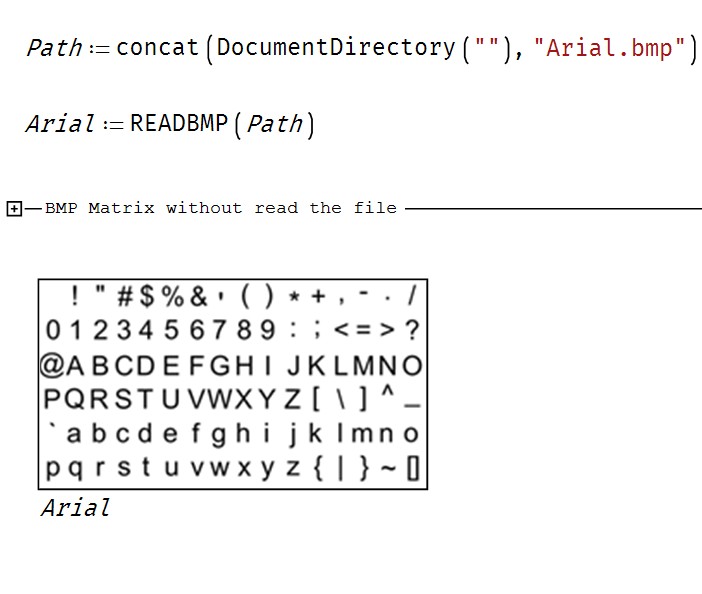
This is the bmp for Arial font (please right click on it and "save as..." ) :
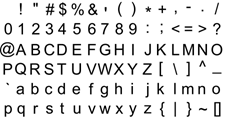
And this is the SMath script for read the bmp and convert it on matrix form for use with the Alvaro's script
Arial BMP.sm (1.03 MiB) downloaded 1430 time(s).
Best wishes,
Oscar
I store the image in a variable until there is a way to obtain the matrix directly from an embedded image in SMath, avoiding the use of external files.
The picture size is (6*20+1) x (16*14+1) . The plus one line and column is because of the border line of the Excel grid. You can leave it or remove it from the matrix, it has no influence.
Using bitmaps to go from a proportional font to a monospaced one is not my invention, there was a time when programmers did not like to count variable lengths of text and when users got bored of always using the same fonts, so this trick was used. It is actually still in use, I think.
There is a trick in the algorithm: The space character is not in the character list, and any character that is not found is written as a space, the zero character.
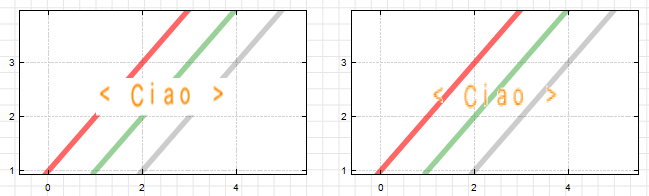
Something I have wanted to do with images, but I haven't been able to, is to rotate them, its application in this case would be to write text at an angle.
Best regards.
Alvaro.
The idea is to develop 2 styles one with the text enclosed in a rectangle as Oscar has shown in a post of him and another without just to save room haveing the orizontal line of the Callout in between the text or at the bottom producing however somethin well readable and clean ..hopefully.
I hope to be able to go ahead now with the pieces already available.
Probably will have issues to define the vertical distance of the line to draw ..it is not clear yet ( but these are jus a little bit of personal brainstorming ) which will be the maximum heigh and width of a character for this new bitmap fonts and which relationship is with their position in vertical/horizontal on the xy Plot region ( I mean an heigh of the font of 1.5 for instance and the position on the x axis of 1 are comparable ? or not ..but I will see while doing ) .
Thanks again and sorry for these bothering discussions.
Best regards
Franco
sorry for disturbing you but I would like to know if it is possible to draw the string of BMP text on the XY Plot Plugin but with a transparent background, as you can imagine going ahead with the project of drawing Callouts rise the problem to have a text that allows to see the background graph or whatsever is in the background otherwise I guess that we lose clarity in what we highlight through the Callout.
I know that BMP doesn't allow a transparent channel ( or not ? ) we should move probably to a PNG format and probably I would be able to save in PNG with a transparent background the font matrix that now are in BNP format but the possibility of the XY Plot Plugin will allow to draw/show images/picture in PNG format with transparency ?
I hope I was able to describe the problem decently.
Thanks in advance for your help and best regards.
Franco
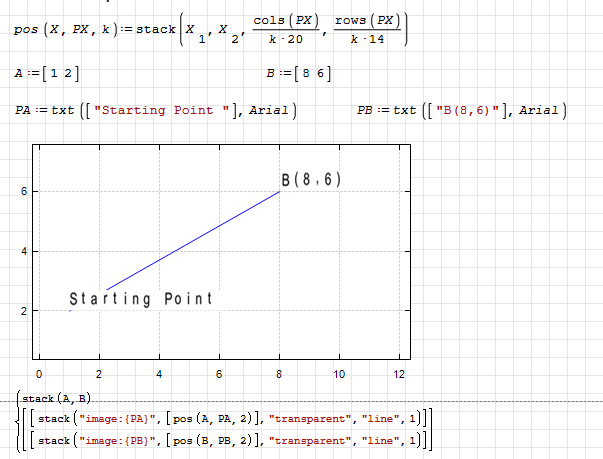
P.S:Herewith we see that the text "Starting point" hide a little bit the starting of the line segment , obviously I have inverted the display order sequence despite the original Alvaro's file to show this.
Best regards.
Alvaro.
XYPlot - Scalable monospaced bitmapped fonts COLOR.sm (2.17 MiB) downloaded 1510 time(s).
Best regards.
Alvaro.
what can I say , is really exceptional what you have done .... the problem is that to understand your initial work about conversion of text in BMP required to me more that a 3 weeks and dont't know how long it will require to understand this further step of yours.
However at least I learn a lot of things ( better to say I think that I learn ...) in the process and I thank you and Oscar for that .
Best regards and all the best for the new year to you and all the developers/collaborators of this forum , take care
Franco
- New Posts
- No New Posts