1 Pages (5 items)
wrong axis labels in plot2d - Messages
#1 Posted: 8/29/2013 1:21:44 PM
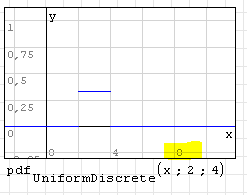
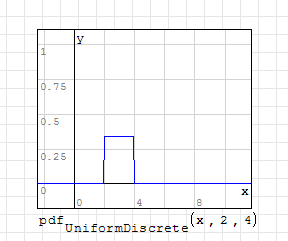
In the 2D plot region, I observed a tick label (number) to switch from the correct value (8) to zero for special scaling values. Even if there is XY-Plot region if nice labeling matters, this might be worth a fix.
Technische Mechanik mit SMath Studio: https://link.springer.com/book/10.1007/978-3-658-50592-9
#2 Posted: 8/29/2013 4:56:21 PM

Hmm...can not reproduce this,
Regards,
Radovan
Regards,
Radovan
When Sisyphus climbed to the top of a hill, they said: "Wrong boulder!"
#3 Posted: 8/29/2013 5:52:22 PM

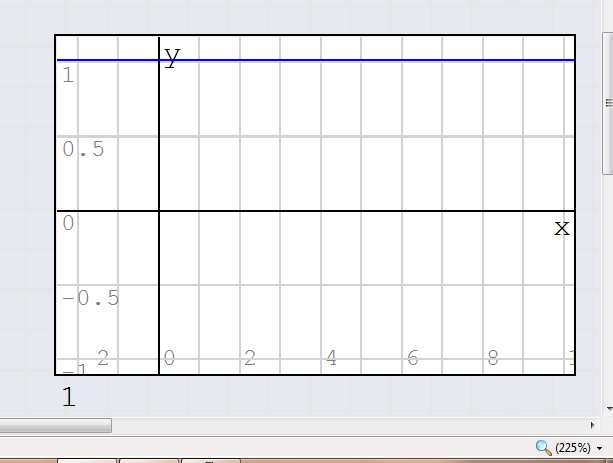
Is not a bug, just an eye-trick due to a combination of font-size, line thickness and line position; if you move the grid or you zoom your page you can see the trick (plot not evaluated)
best regards,
Davide
best regards,
Davide
If you like my plugins please consider to support the program buying a license; for personal contributions to me: paypal.me/dcprojects
1 users liked this post
Martin Kraska 8/29/2013 9:32:00 PM
#4 Posted: 8/29/2013 9:32:11 PM
WroteIs not a bug, just an eye-trick due to a combination of font-size, line thickness and line position; if you move the grid or you zoom your page you can see the trick
Thanks for pointing this out. Then the remedy is easy: change the z-order of the objects (grid to bottom). I did not note that the grid is in front of the tick labels.
Technische Mechanik mit SMath Studio: https://link.springer.com/book/10.1007/978-3-658-50592-9
#5 Posted: 8/30/2013 6:55:02 AM
WroteThanks for pointing this out. Then the remedy is easy: change the z-order of the objects (grid to bottom). I did not note that the grid is in front of the tick labels.
I agree, should be the easiest solution

If you like my plugins please consider to support the program buying a license; for personal contributions to me: paypal.me/dcprojects
1 Pages (5 items)
- New Posts
- No New Posts