1 страниц (16 вхождений)
Оптимизация - Долгое время расчета - Сообщения
Добрый день.
Помогите (или подскажите) пожалуйста с оптимизацией. Довольно долгий расчет (около 30 сек). Если уменьшить параметр m, то время расчета уменьшается, но хотелось бы как то оптимизировать.Gidrodinamika.sm (105,86 КиБ) скачан 1032 раз(а).
Помогите (или подскажите) пожалуйста с оптимизацией. Довольно долгий расчет (около 30 сек). Если уменьшить параметр m, то время расчета уменьшается, но хотелось бы как то оптимизировать.Gidrodinamika.sm (105,86 КиБ) скачан 1032 раз(а).
If you shorten the code, then the calculation is performed
an order of magnitude faster
Gidrodinamika1.sm (111,05 КиБ) скачан 1039 раз(а).
an order of magnitude faster
Gidrodinamika1.sm (111,05 КиБ) скачан 1039 раз(а).
1 пользователям понравился этот пост
Serg 28.02.2021 04:17:00
Финальный расчет во вложении.
Большое спасибо Ber7 за помощь в оптимизации
Opredelenie gidrodinamicheskogo davlenija_v001.sm (128,74 КиБ) скачан 1106 раз(а).
Большое спасибо Ber7 за помощь в оптимизации
Opredelenie gidrodinamicheskogo davlenija_v001.sm (128,74 КиБ) скачан 1106 раз(а).
Эх, по поводу "финальной" это я погорячился.
Как оказалось есть недочет в 1 формуле.
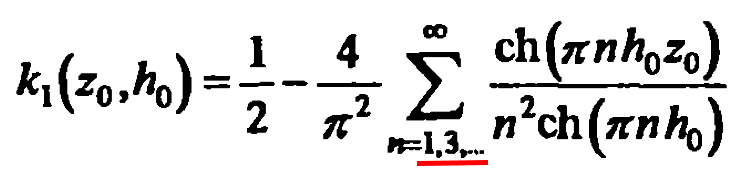
Как это реализовать можно?
Т.е. именно в сумму входят только нечетные номера.
Как оказалось есть недочет в 1 формуле.
Как это реализовать можно?
Т.е. именно в сумму входят только нечетные номера.
I don't understand this formula, but Try to substitute 2n -1 instead of n
2n-1.sm (134,68 КиБ) скачан 1012 раз(а).
2n-1.sm (134,68 КиБ) скачан 1012 раз(а).
1 пользователям понравился этот пост
Serg 01.03.2021 07:39:00
WroteI don't understand this formula, but Try to substitute 2n -1 instead of n
2n-1.sm (134,68 КиБ) скачан 1012 раз(а).
Да это то, что нужно. Спасибо.
Opredelenie gidrodinamicheskogo davlenija_v001.sm (187,99 КиБ) скачан 1081 раз(а).
WroteI don't understand this formula
I don't understand much in there either.
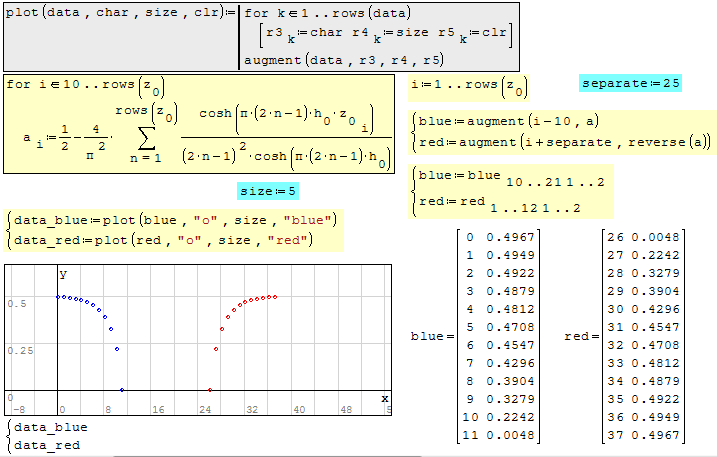
We can get the shape of the upper right image.
2n-1.sm (142,77 КиБ) скачан 1003 раз(а).
WroteWhat's your comment on that ?
Визуально очень похоже... нужно потестировать по ряду значений ... есть графики в книге Бирбраера (рис. 9.9). Я его оцифровывал с помощью GetData Graph Digitizer (примерно конечно).Birbraer_ris.9.9.xlsx (103,48 КиБ) скачан 741 раз(а).
Именно эта формула и графики одно и тоже.
В Smath у меня эта эпюра ломается внизу ... пока не разобрался почему.
WroteGetData Graph Digitizer
We can do it in Smath providing the image is cleaned manually
and the coordinates [Xmax, Xmin ...Ymax, Ymin] are given or
otherwise guesstimated. Freeware Tracer can do as well but
again cleaned image and coordinates.
Your approximation sounds OK ... many more can be envisaged.
My little Russian is dead for over 50 years .
Cheers ... Jean
1 пользователям понравился этот пост
Serg 02.03.2021 10:33:00
Wrote... smoothed data from Tracer.
... it can be improved a bit. But, what a dirty image to digitize !
Page15 Tracer.sm (71,66 КиБ) скачан 1214 раз(а).
This document resumes and compares your fitting model
vs the digitized image, from improved session.
You may attempt to adapt your model to the digitized data.
Maybe there is a Thiele fit to your blue/red data points.
I will try that soon ... Jean.
2n-1 [Jean].sm (188,23 КиБ) скачан 794 раз(а).
vs the digitized image, from improved session.
You may attempt to adapt your model to the digitized data.
Maybe there is a Thiele fit to your blue/red data points.
I will try that soon ... Jean.
2n-1 [Jean].sm (188,23 КиБ) скачан 794 раз(а).
1 пользователям понравился этот пост
Serg 02.03.2021 15:16:00
В книге Бирбраера рис. 9.8 несет в себе только информацию касаемо куда какая нагрузка прикладывается и форма приведена условно, т.е. схема. Сам рис. 9.8 не претендует на оцифровку - это не график, а картинка.
А вот рис. 9.9 - это набор графиков уже и именно их я и оцифровывал еще когда не разобрался с формулой 9.51.
Т.е. именно этот набор графиков определяет форму эпюры гидродинамического давления.
А вот рис. 9.9 - это набор графиков уже и именно их я и оцифровывал еще когда не разобрался с формулой 9.51.
Т.е. именно этот набор графиков определяет форму эпюры гидродинамического давления.
In Birbraer's book, fig. 9.8 carries only information with regards to where what load is applied and the form is given conditionally, i.e. scheme. The rice itself. 9.8 does not pretend to be digitized - it is not a graph, but a picture.
And here is rice. 9.9 is a set of graphs already, and it was them that I digitized even when I had not figured out the formula 9.51.
Thus, it is this set of plots that determines the shape of the hydrodynamic pressure plot.
...................
So, my understanding is that the formula 9.51 is the one that determines,
the hydrodynamic pressure. It looks damned close parent to Eiffel Tower shape.
Then, it is not needed to be discretized, simply plot scalar.
However, I don't think you can plot opposite reverse, wish I'm wrong.
Very interesting project, thanks ... Jean
2n-1 [Jean].sm (243,28 КиБ) скачан 772 раз(а).
1 страниц (16 вхождений)
- Новые сообщения
- Нет новых сообщений