1 страниц (6 вхождений)
Contour Plots - Сообщения
Greetings all-
I am starting a new thread to start a discussion about contour plots. The discussions about contour plots that I have found here so far have been about some pretty high level math that I am not familiar with.
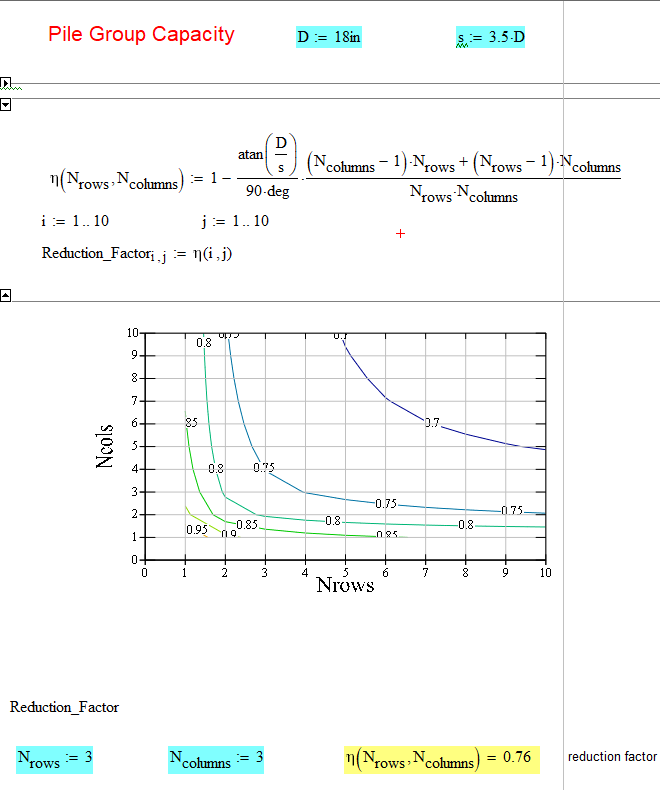
I am trying to visualize the results of an interaction equation. MathCad was pretty efficient at making contour plots of 3D plots.
I thought it might be pretty straight forward to recreated it in SMath not realizing the approach would involve some really creative and advanced solution solving. Thanks to all who dove in to show me ways to do this.
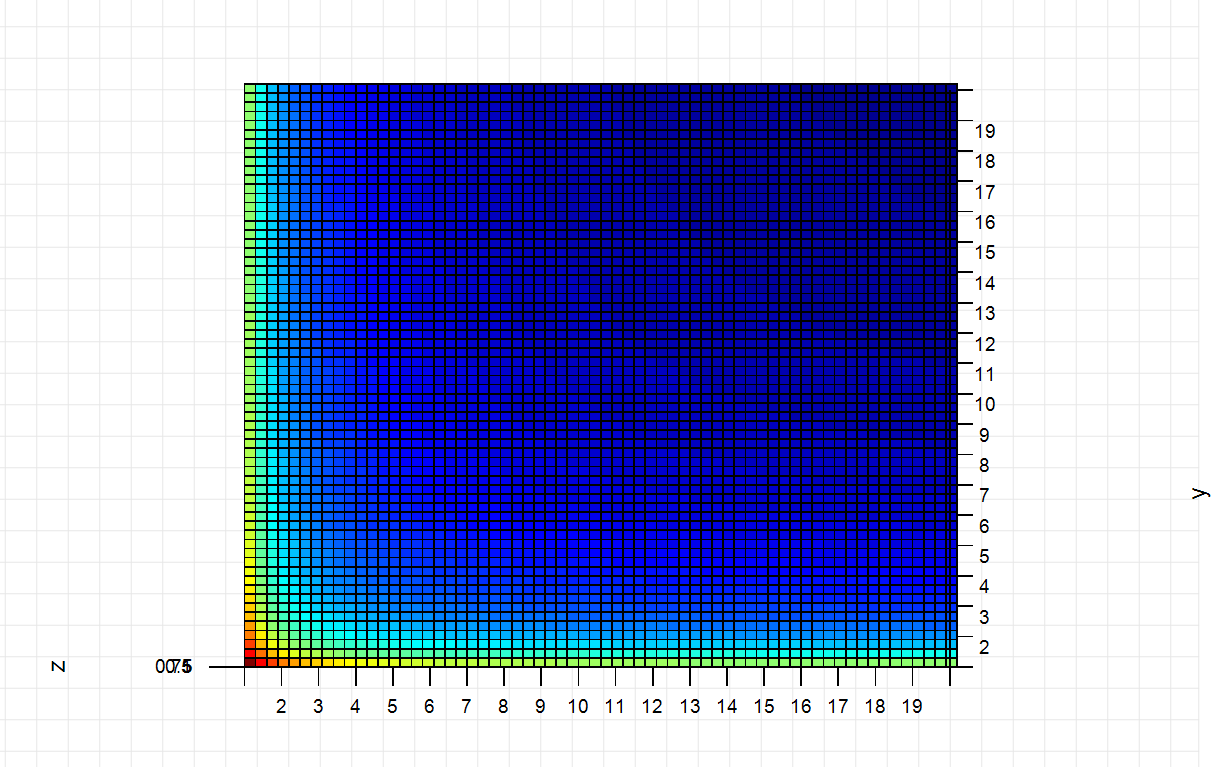
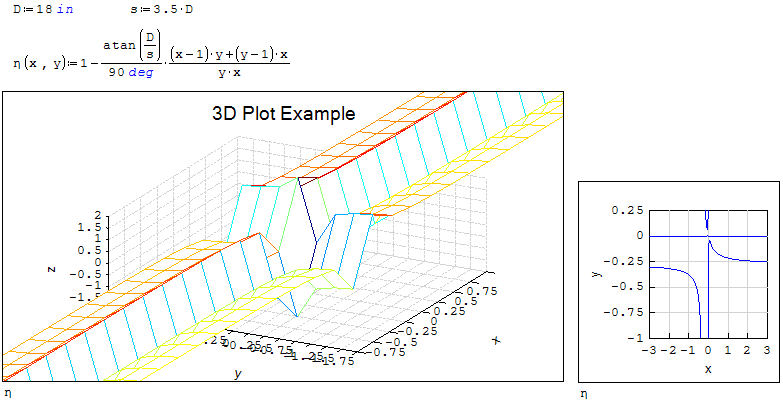
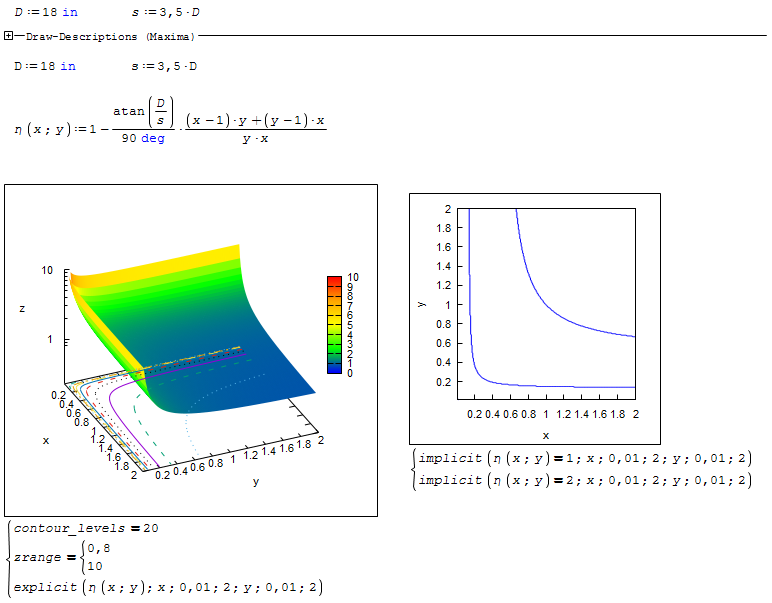
I then tried to plot it as a 3D plot, which I had never done before. After tweaking the axis' a bit, this is my result
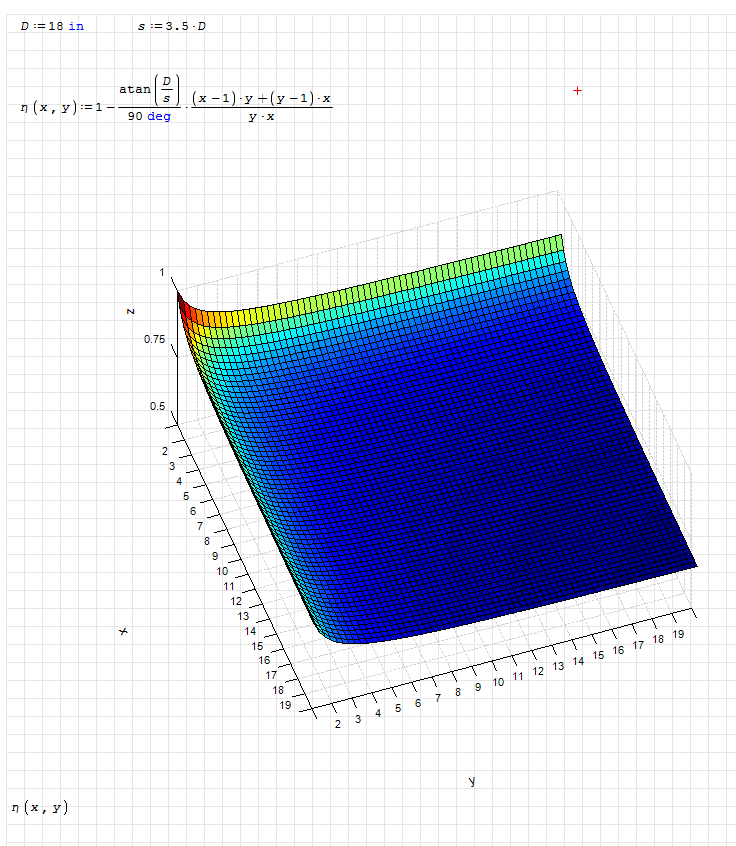
The isolines/contours as you can see are actually pretty well defined.
1. Now I am trying to work out how to do the isolines solved as a pair of range series.
2. Figure out how to incorporate Razonar's graph formatting examples to 3D plots.
https://en.smath.com/forum/yaf_postsm46993_Bresenham-Algorithm.aspx#post46993
PileRedux_Factor-2.sm (4,1 КиБ) скачан 962 раз(а).
I am starting a new thread to start a discussion about contour plots. The discussions about contour plots that I have found here so far have been about some pretty high level math that I am not familiar with.
I am trying to visualize the results of an interaction equation. MathCad was pretty efficient at making contour plots of 3D plots.
I thought it might be pretty straight forward to recreated it in SMath not realizing the approach would involve some really creative and advanced solution solving. Thanks to all who dove in to show me ways to do this.
I then tried to plot it as a 3D plot, which I had never done before. After tweaking the axis' a bit, this is my result
The isolines/contours as you can see are actually pretty well defined.
1. Now I am trying to work out how to do the isolines solved as a pair of range series.
2. Figure out how to incorporate Razonar's graph formatting examples to 3D plots.
https://en.smath.com/forum/yaf_postsm46993_Bresenham-Algorithm.aspx#post46993
PileRedux_Factor-2.sm (4,1 КиБ) скачан 962 раз(а).
Join the SMath Studio Users Discord Channel: https://discord.gg/PayZpJW
Some comments:
1. Smath plots contour directly from f(x,y) ... plot argument f
2. Not twoo many maths functions make sense
3. Smath does not have 3D matrix plot.
4. Smath 3D plot is only surface.
5. Generally does not save settings.
6. Ranges from hardly acceptable to "crapot".
1. Smath plots contour directly from f(x,y) ... plot argument f
2. Not twoo many maths functions make sense
3. Smath does not have 3D matrix plot.
4. Smath 3D plot is only surface.
5. Generally does not save settings.
6. Ranges from hardly acceptable to "crapot".
Hi.
This is very simple setup, but looks to me like a cheat over Viachislev's XY plot, and I'm not sure if this setup is 'correct'. Maybe uni or someone else can say that.
Contour X_Y plot.sm (11,77 КиБ) скачан 969 раз(а).
Bresenham's plots are intended for use within a 2D milling CNC machine :-) Or just show to the students how can implement that, because I refuse to show those things to students in C.
Best regards.
Alvaro.
Wrote... The discussions about contour plots that I have found here so far have been about some pretty high level math that I am not familiar with.
This is very simple setup, but looks to me like a cheat over Viachislev's XY plot, and I'm not sure if this setup is 'correct'. Maybe uni or someone else can say that.
Contour X_Y plot.sm (11,77 КиБ) скачан 969 раз(а).
Wrote... 2. Figure out how to incorporate Razonar's graph formatting examples to 3D plots.
https://en.smath.com/forum/yaf_postsm46993_Bresenham-Algorithm.aspx#post46993
Bresenham's plots are intended for use within a 2D milling CNC machine :-) Or just show to the students how can implement that, because I refuse to show those things to students in C.
Best regards.
Alvaro.
Technische Mechanik mit SMath Studio: https://link.springer.com/book/10.1007/978-3-658-50592-9
Martin-
I feel even stupider still I am having trouble finding documentation for these functions.
Where should I be looking to read up to understand the parameters and controls on these?
Am I missing some documents or references in my installation?
Dennis
I feel even stupider still I am having trouble finding documentation for these functions.
Where should I be looking to read up to understand the parameters and controls on these?
Am I missing some documents or references in my installation?
Dennis
Join the SMath Studio Users Discord Channel: https://discord.gg/PayZpJW
Wrote
Where should I be looking to read up to understand the parameters and controls on these?
You can download the SMath Handbuch (PDF) or the Interactive Handbook (interlinked SMath sheets) from the extension manager. There you find extensive material and examples on the graphics objects and options of the "draw"-package in Maxima.
Also, the original Maxima documentation on that package might be useful.
Technische Mechanik mit SMath Studio: https://link.springer.com/book/10.1007/978-3-658-50592-9
1 страниц (6 вхождений)
- Новые сообщения
- Нет новых сообщений