1 страниц (11 вхождений)
2D-Plot problem (regression) - Сообщения
The 2D plot exhibits a problem in build 8348, which didn't appear in previous versions. In 7561 it works, however, the attached file can't be opened, you have to copy/paste the content)
In more recent versions I experienced crashes related to the extension manager (online gallery). This is perhaps due to ongoing re-structuring of the website.
The problem:
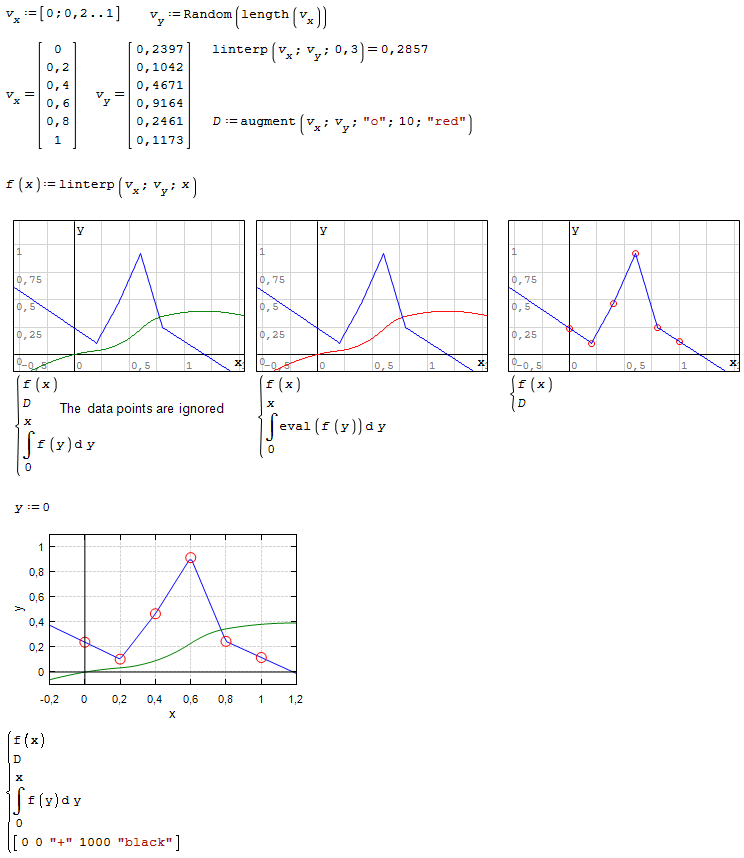
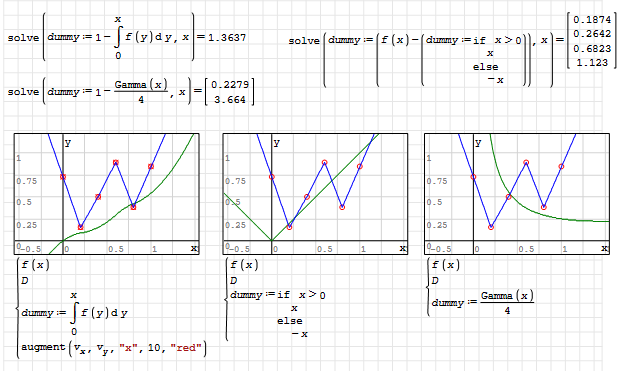
The built-in 2D plot can't plot f(x), D and the integral of f(x) at the same time. f(x) and D work, f(x) and integral work but not all three at once.
The X-Y plot plugin can handle all three at once, yet you have to make sure that the dummy variable in the integral isn't taken as undefined.
Perhaps wrapping eval() around random subexpressions or modifying all or some of the involved definitions by line operator could provide a work-around, yet I consider the problem being a bug or at least a change to the worse.
plot interp.sm (11,58 КиБ) скачан 1384 раз(а).
In more recent versions I experienced crashes related to the extension manager (online gallery). This is perhaps due to ongoing re-structuring of the website.
The problem:
The built-in 2D plot can't plot f(x), D and the integral of f(x) at the same time. f(x) and D work, f(x) and integral work but not all three at once.
The X-Y plot plugin can handle all three at once, yet you have to make sure that the dummy variable in the integral isn't taken as undefined.
Perhaps wrapping eval() around random subexpressions or modifying all or some of the involved definitions by line operator could provide a work-around, yet I consider the problem being a bug or at least a change to the worse.
plot interp.sm (11,58 КиБ) скачан 1384 раз(а).
Technische Mechanik mit SMath Studio: https://link.springer.com/book/10.1007/978-3-658-50592-9
WroteThe built-in 2D plot can't plot f(x), D and the integral of f(x) at the same time.
f(x) and D work, f(x) and integral work but not all three at once.
Commonly encountered from NON-NATIVE functions.
Isolate 'D' ... add as argument plot QuickPlot
Same Studio versions and Solver 30405.
Maybe the problem is with string plotting.
It can't get dots plot if used in a variable.
When copy pasted, it can however.
Regards
It can't get dots plot if used in a variable.
When copy pasted, it can however.
Regards
1 пользователям понравился этот пост
Martin Kraska 09.08.2023 19:34:00
Alternately, plot f(x) & the XY augmented data points,
XY as plotting argument instead of the expansion.
Next, discretize f(x) and add the FD cumulative on the plot.
At this point you have the 3 on same 2D Quick Plot.
FD [Finite Differences] is exceptionally accurate,
often used as a yardstick sanity check.
In your example, FD & Simpson agree to 6 decimals.
Cheers ... Jean.
WroteMaybe the problem is with string plotting.
It can't get dots plot if used in a variable.
When copy pasted, it can however.
Regards
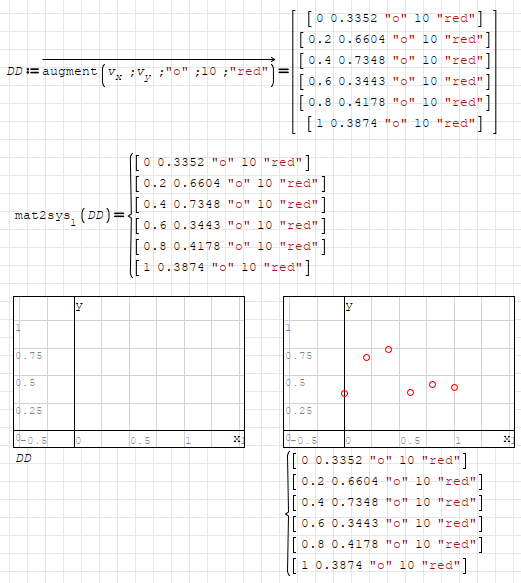
This is perhaps another similar problem but not the same one. In my example, the right plot shows that string plotting from a variable isn't an issue in general.
The problem comes if combined with the integral.
BTW the behaviour doesn't change when I replace D everywhere by the expression.
Another BTW: I don't think you need to vectorize the augment operation.
Technische Mechanik mit SMath Studio: https://link.springer.com/book/10.1007/978-3-658-50592-9
Wrote... The problem comes if combined with the integral.
Hi Martin. You can add if() to the list. Usually, if something is wrong with int, it is also wrong with if and vice versa.
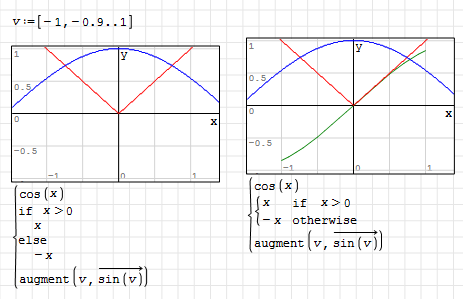
Best regards.
Alvaro.
1 пользователям понравился этот пост
Martin Kraska 09.08.2023 19:34:00
Wrote
Hi Martin. You can add if() to the list. Usually, if something is wrong with int, it is also wrong with if and vice versa.
Best regards.
Alvaro.
Yes, the behaviour is indeed similar. if() and f(x) work but not if(), f(x) and a matrix.
Again the X-Y plot proves to be more robust.
I was going to file a bug report, yet I found that there is already a related bug, filed 9 years ago: SS-41.
The original report was with the Gamma function. Either it is because Gamma uses if() or it is another instance of the bug.
plot interp.sm (17,06 КиБ) скачан 1363 раз(а).
![2023-08-10 00_32_55-SMath Solver - [plot interp.sm_].png](/ru-RU/files/Download/TPVCNg/2023-08-10-00_32_55-SMath-Solver---[plot-interp.sm_].png)
Technische Mechanik mit SMath Studio: https://link.springer.com/book/10.1007/978-3-658-50592-9
... alternately.
discretize Simpson ... Bingo 3 plots on same Quick Plot
discretize Simpson ... Bingo 3 plots on same Quick Plot
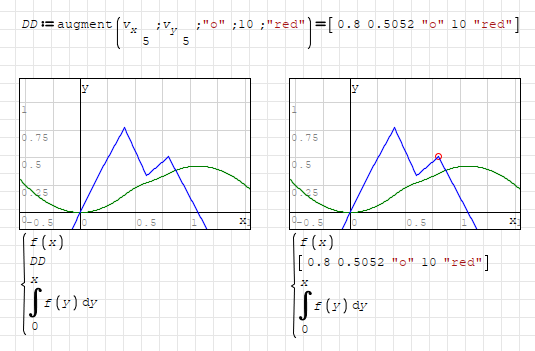
WroteAnother BTW: I don't think you need to vectorize the augment operation.
I didn't need, but I did to show even individual strings doesn't plot.
Here you can see another fail even with a single string variable.
Regards
Hi. The workaround. It also solve the roots issue with int() and if()!.
plot interp.sm (20,01 КиБ) скачан 1446 раз(а).
Best regards.
Alvaro.
plot interp.sm (20,01 КиБ) скачан 1446 раз(а).
Best regards.
Alvaro.
WroteHi. The workaround. It also solve the roots issue with int() and if()!.
Best regards.
Alvaro.
May this be a hint for eventual improvement of the plot region.
Technische Mechanik mit SMath Studio: https://link.springer.com/book/10.1007/978-3-658-50592-9
1 страниц (11 вхождений)
- Новые сообщения
- Нет новых сообщений