Maple Tools - Symbolic engine for SMath Studio. - Сообщения

325 сообщений из 2 052 понравились и 1 не понравились пользователям.
Группа: Moderator

I do not know how to solve them in one step like. How to put sets - {} in the command?
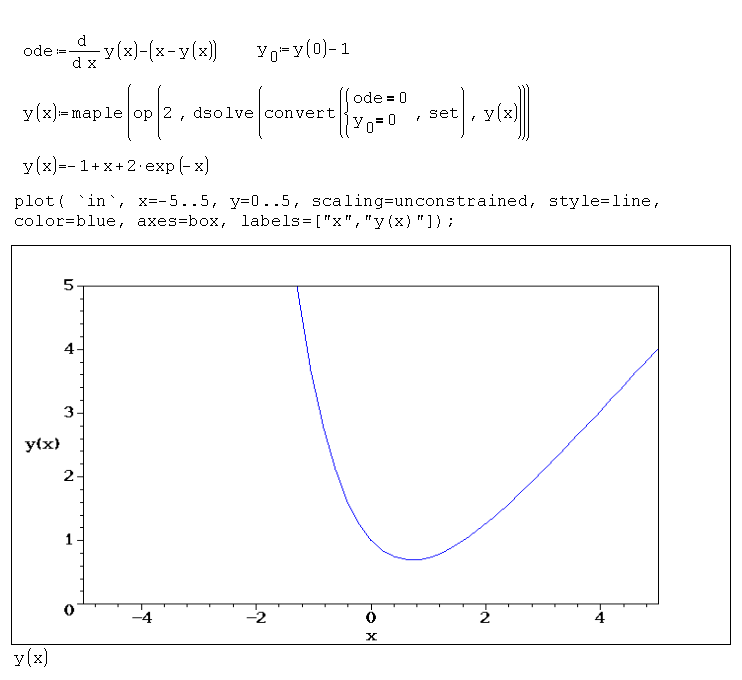
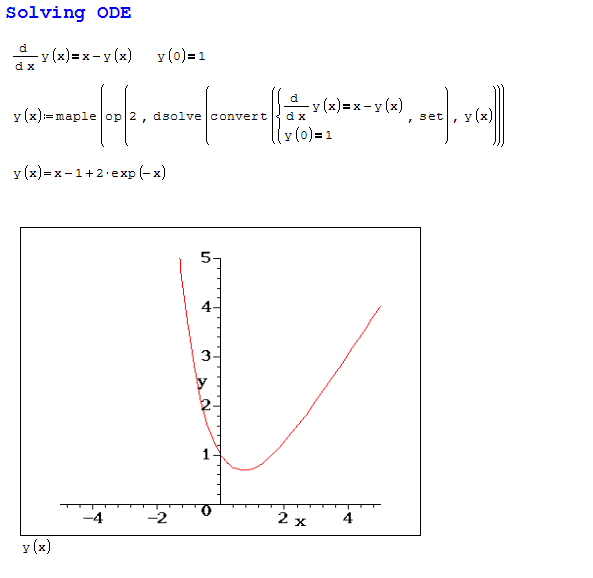
>dsolve({D(y)(x)=x-y,y(0)=1},y(x))
Could someone give some help?
Regards,
Radovan
ode2.sm (13,69 КиБ) скачан 1346 раз(а).

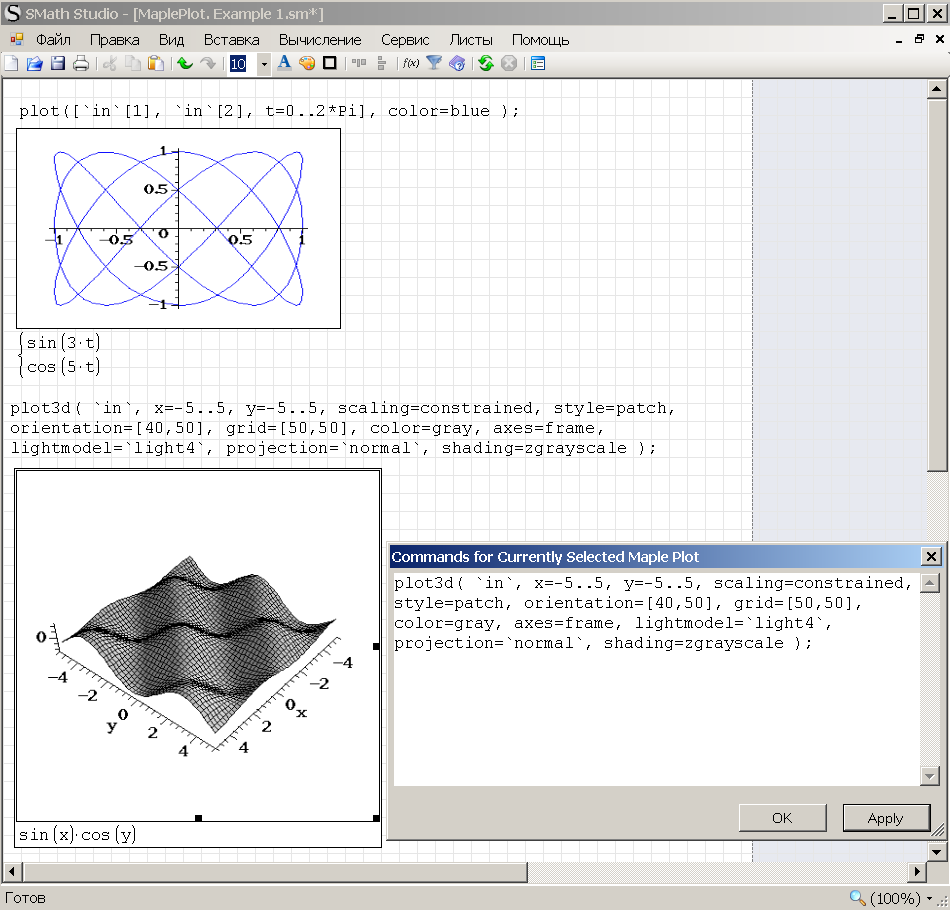
plot([`in`[1], `in`[2], t=0..2*Pi], color=blue );
plot3d( `in`, x=-5..5, y=-5..5, scaling=constrained, style=patch,
orientation=[40,50], grid=[50,50], color=gray, axes=frame,
lightmodel=`light4`, projection=`normal`, shading=zgrayscale );
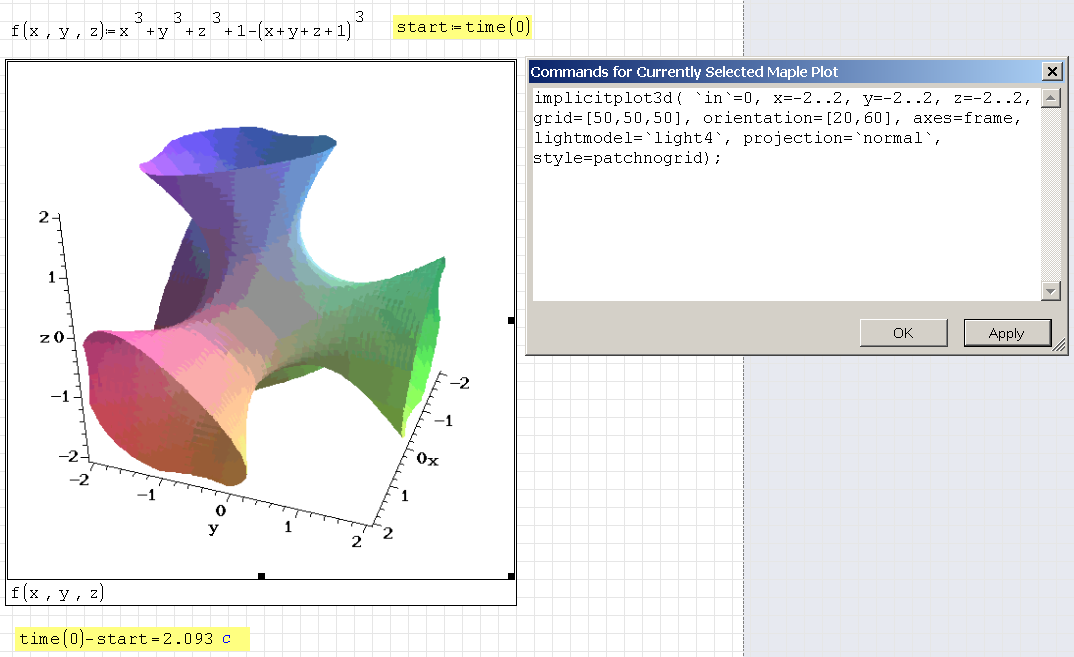
implicitplot3d( `in`=0, x=-2..2, y=-2..2, z=-2..2, grid=[50,50,50], orientation=[20,60],
axes=frame, lightmodel=`light4`, projection=`normal`, style=patchnogrid);
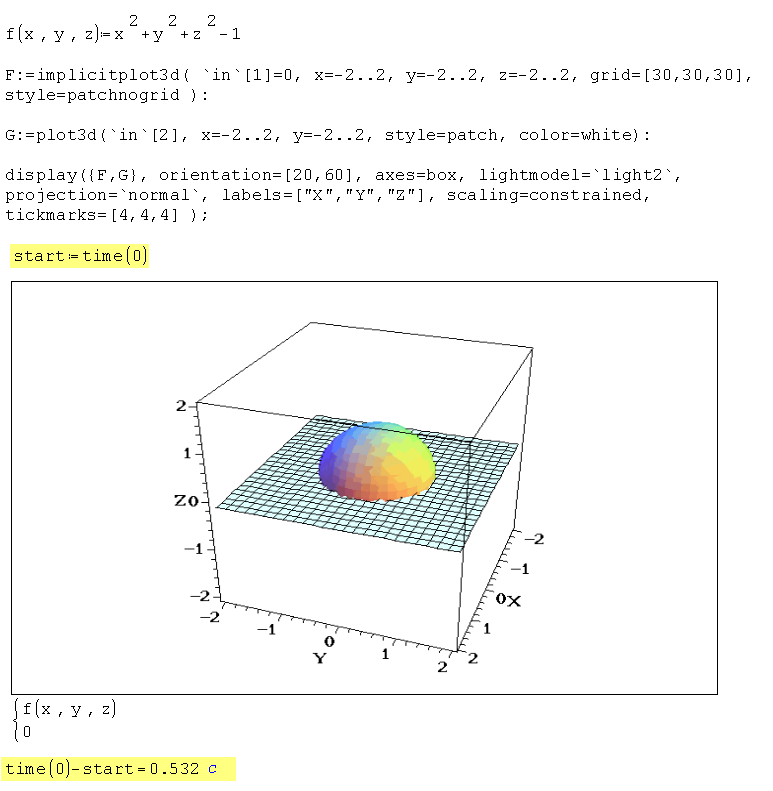
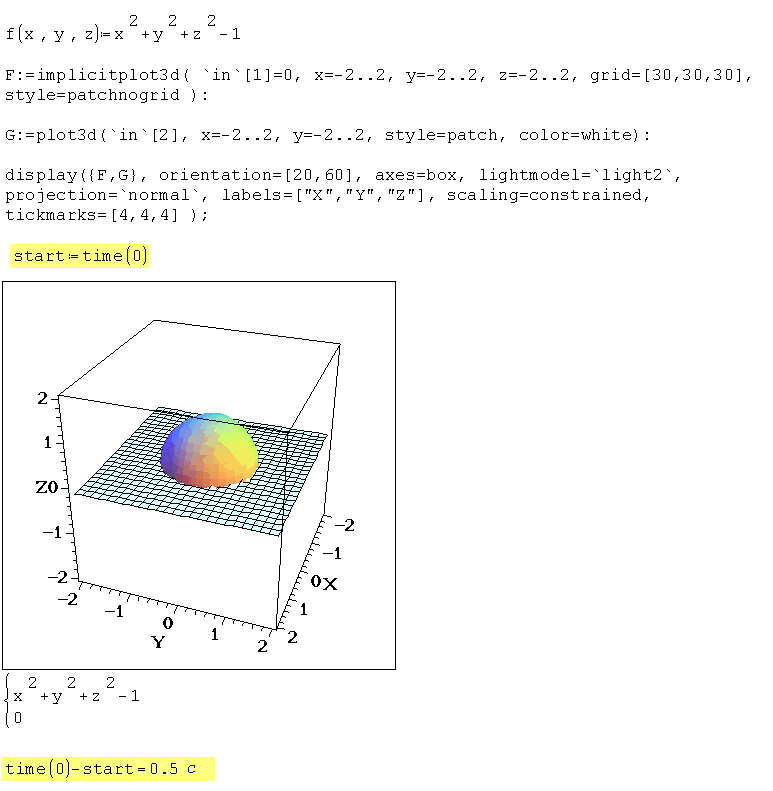
F:=implicitplot3d( `in`[1]=0, x=-2..2, y=-2..2, z=-2..2, grid=[30,30,30],
style=patchnogrid ):
G:=plot3d(`in`[2], x=-2..2, y=-2..2, style=patch, color=white):
display({F,G}, orientation=[20,60], axes=box, lightmodel=`light2`,
projection=`normal`, labels=["X","Y","Z"], scaling=constrained,
tickmarks=[4,4,4] );
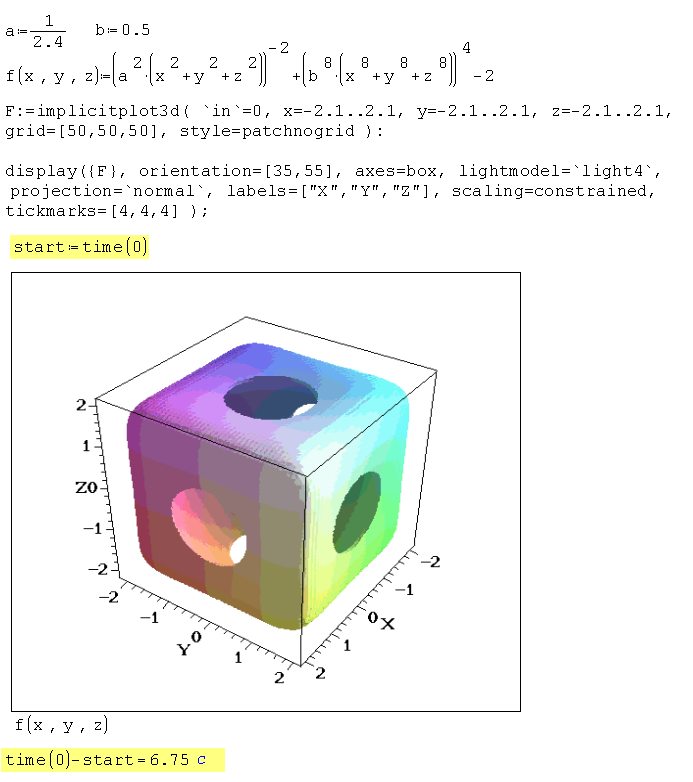
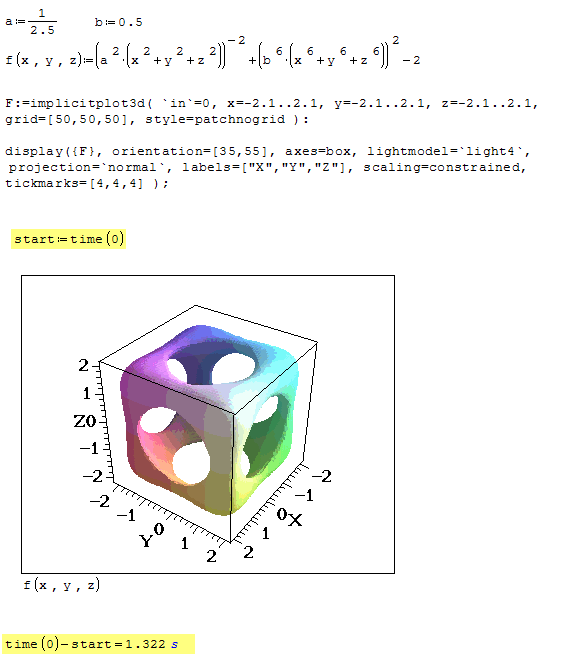
[MATH]f(x;y;z)
 a^2*(x^2+y^2+z^2))^{-2}+(b^8*(x^8+y^8+z^8))^4-2[/MATH]
F:=implicitplot3d( `in`=0, x=-2.1..2.1, y=-2.1..2.1, z=-2.1..2.1,
grid=[50,50,50], style=patchnogrid ):
display({F}, orientation=[35,55], axes=box, lightmodel=`light4`,
projection=`normal`, labels=["X","Y","Z"], scaling=constrained,
tickmarks=[4,4,4] );
WroteI do not know how to solve them in one step like. How to put sets - {} in the command?
>dsolve({D(y)(x)=x-y,y(0)=1},y(x))
Could someone give some help?
325 сообщений из 2 052 понравились и 1 не понравились пользователям.
Группа: Moderator

Strange, but this one was the only one successful
My other attempts in making plots and reproducing your pictures, issued an error about missing gif file in tmp folder. See the picture please
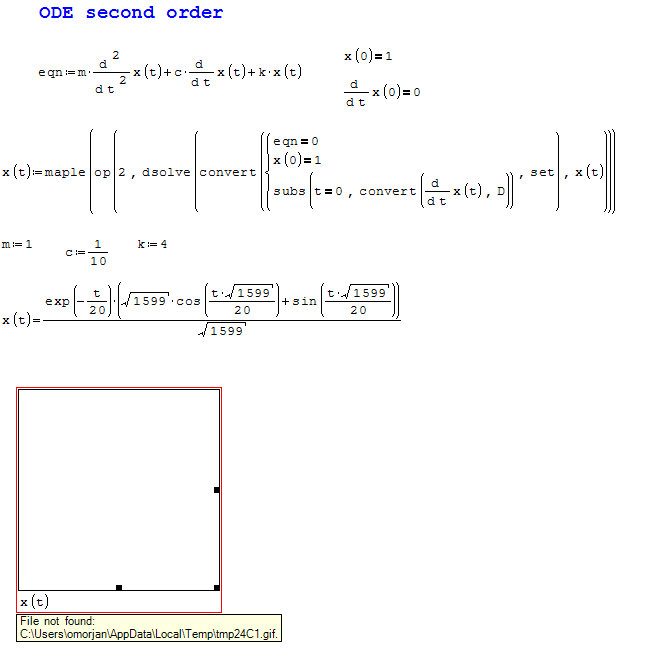
The problem of not saving pictures and SMat crash still remained.
Regards,
Radovan
325 сообщений из 2 052 понравились и 1 не понравились пользователям.
Группа: Moderator
WroteShow me the log file: mvr5.txt.
Here it is. If you want me something in particular to try, just let me know.
Regards,
Radovan
mvr5.txt (192,04 КиБ) скачан 1038 раз(а).
325 сообщений из 2 052 понравились и 1 не понравились пользователям.
Группа: Moderator
WroteWroteShow me the log file: mvr5.txt.
Here it is. If you want me something in particular to try, just let me know.
Regards,
Radovan
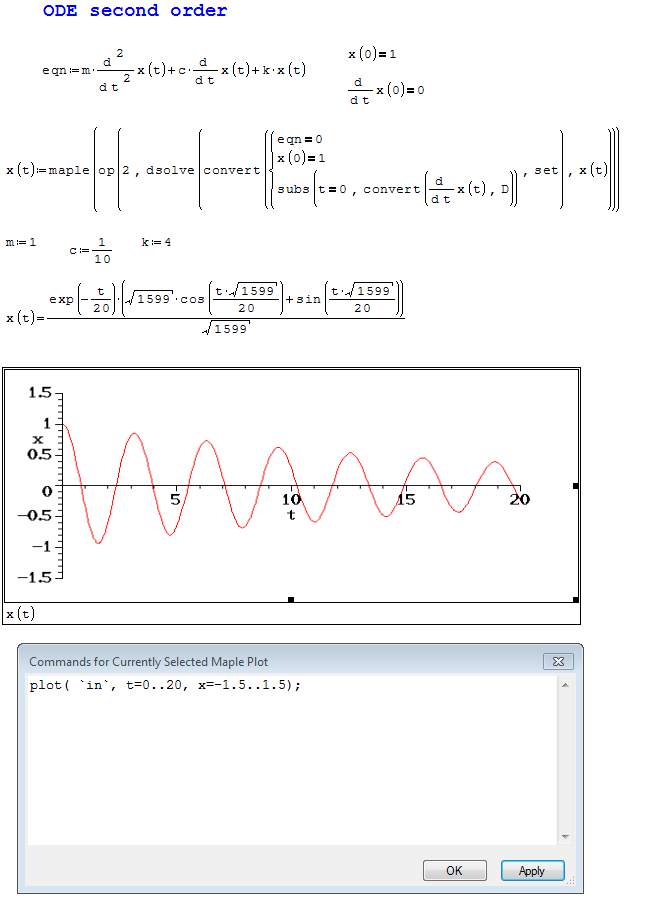
Radovan, you have to change the maple-commands for each graph. In your example these commands are set incorrectly. I specifically show the commands. They need to be inserted into the settings form, as showed above.
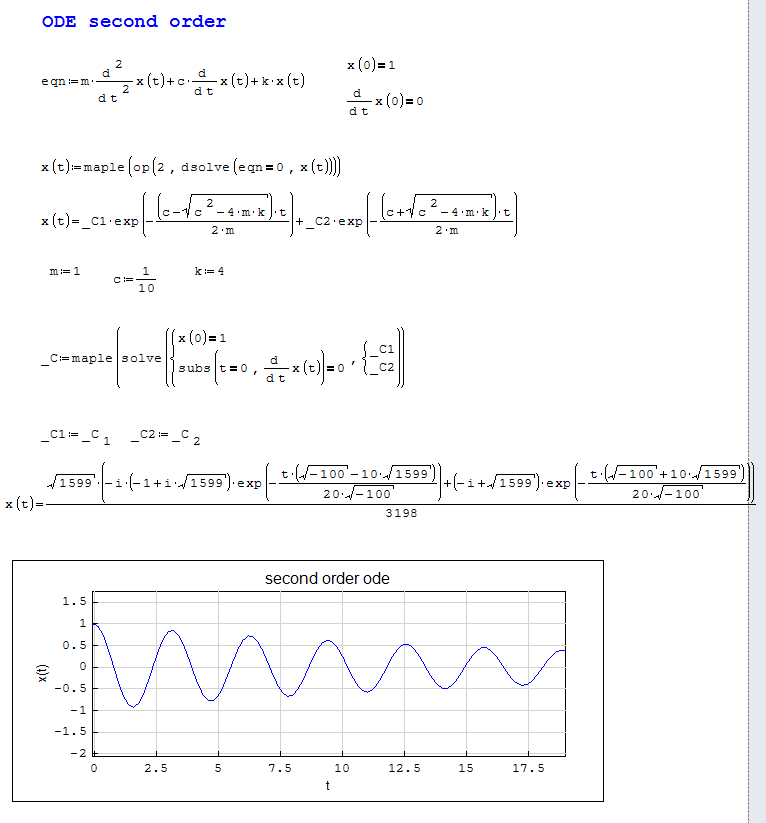
1) Try this:
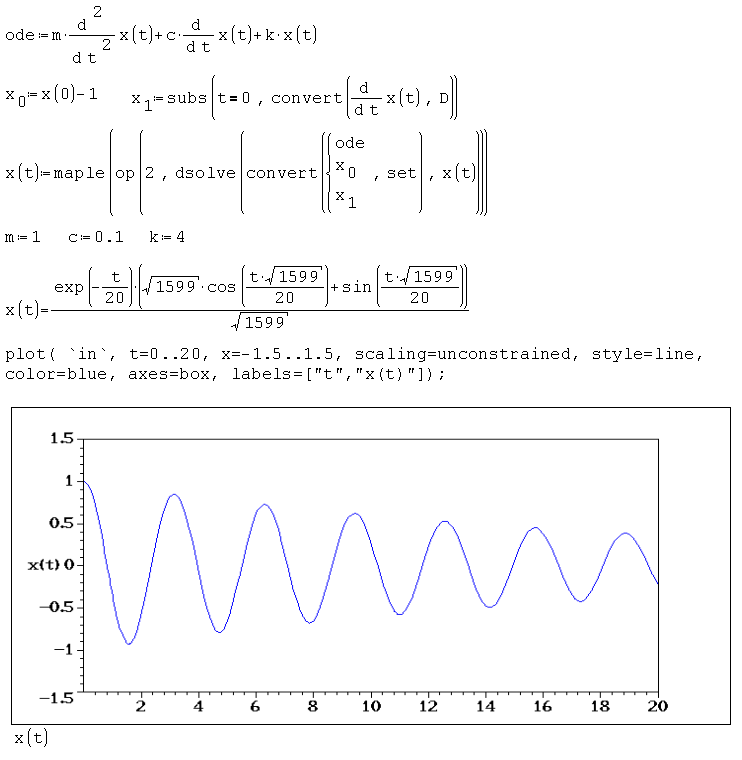
a := plot( `in`, t=0..20, x=-1.5..1.5, scaling=unconstrained, style=line,
color=blue, axes=box, labels=["t","x(t) "]):
b := coordplot(rectangular, [0..20, -1.5..1.5], linestyle=[7,7],
color=[gray,gray]):
display([a,b]);
2) projection=`normal must be projection=`normal`
325 сообщений из 2 052 понравились и 1 не понравились пользователям.
Группа: Moderator
.Tried one of your examples, and typed carefully as much as I could. I did not see any mistake - but the plot did not appear (the second picture)

Regards,
Radovan
mvr5.txt (265,75 КиБ) скачан 1111 раз(а).
Цитатаwith(linalg):with(inttrans):with(plots):
325 сообщений из 2 052 понравились и 1 не понравились пользователям.
Группа: Moderator
WroteTry to add with(plots): to with.inc:
Цитатаwith(linalg):with(inttrans):with(plots):
It worked
. What was the catch?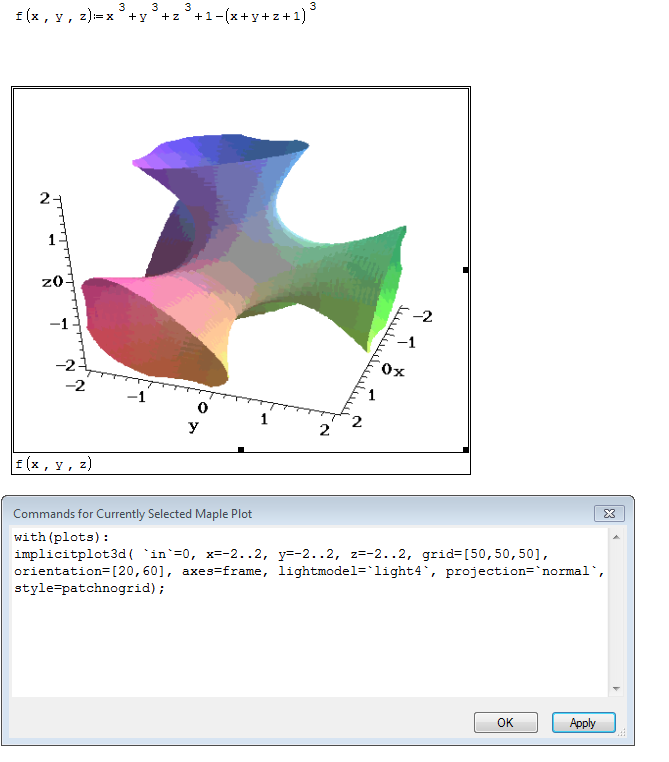
325 сообщений из 2 052 понравились и 1 не понравились пользователям.
Группа: Moderator
325 сообщений из 2 052 понравились и 1 не понравились пользователям.
Группа: Moderator
Heartily please for the prompt, how to check in Maple that two expressions are to themselves equal. For example whether the expression under variable a is such alone as the expression under variable b?
Regards,
Janusz
325 сообщений из 2 052 понравились и 1 не понравились пользователям.
Группа: Moderator
WroteHeartily please for the prompt, how to check in Maple that two expressions are to themselves equal. For example whether the expression under variable a is such alone as the expression under variable b?
I do not use maple to much (it is interesting and a fun using it in SMath
) , and someone else might give you a better solution - but this should work[MATH=eng]e1
a^2-1)*1/sqrt(a)[/MATH][MATH=eng]e2
b-1)*(b+1)/sqrt(b)[/MATH][MATH=eng]maple(simplify(subs(a≡b,e1)-e2))=0[/MATH]
Regards,
Radoavn
Thank you, interesting solution, will try out it.
Regards,
Janusz
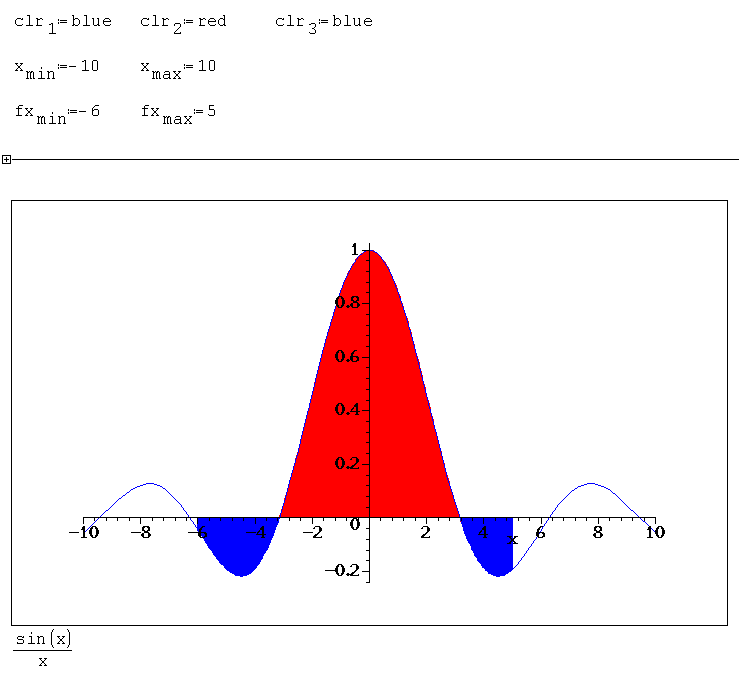
FillCurve := proc(f,a,b,am,bm)
local i,n,x1,x2,y1,y2,A,d:
n := 200;
d := ( b - a ) / n;
x2 := a;
for i from 1 to n do
x1 := evalf( x2 );
x2 := evalf( a + i * d );
y1 := evalf( f( x1 ) );
y2 := evalf( f( x2 ) );
if ( y1 > 0 ) then
A[i] := polygonplot( [ [x1, 0], [x1, y1], [x2, y2], [x2, 0] ], color=`::clr.2`, style=patchnogrid );
else
A[i] := polygonplot( [ [x1, 0], [x1, y1], [x2, y2], [x2, 0] ], color=`::clr.3`, style=patchnogrid );
fi;
od:
display( [ plot( f(x), x = am..bm, color=`::clr.1`, discont=true ), seq( A[i], i=1..n ) ] );
end:
FillCurve(x->`in`,`::fx.min`,`::fx.max`,`::x.min`,`::x.max`);
MaplePlot. Example 8.sm (4,9 КиБ) скачан 1371 раз(а).
I have still trouble with the basics. Example 2 does not work.
Here is what the log file says:
27.05.2013 08:10:59 [->] D:\tmp\tmp59BE.tmp:
interface(quiet=true);
with(linalg):with(inttrans):with(plots):
plotsetup(gif, plotoutput="D:\\tmp\\tmp59BF.gif", plotoptions=`height=409,width=457`);
F:=implicitplot3d( =0, x=-2..2, y=-2..2, z=-2..2, grid=[30,30,30],
style=patchnogrid ):
G:=plot3d(, x=-2..2, y=-2..2, style=patch, color=white):
display({F,G}, orientation=[20,60], axes=box, lightmodel=`light2`,
projection=`normal`, labels=["X","Y","Z"], scaling=constrained,
tickmarks=[4,4,4] );
quit:
27.05.2013 08:10:59 [->] D:\tmp\tmp59FE.tmp:
interface(quiet=true);
with(linalg):with(inttrans):with(plots):
plotsetup(gif, plotoutput="D:\\tmp\\tmp5A0F.gif", plotoptions=`height=409,width=457`);
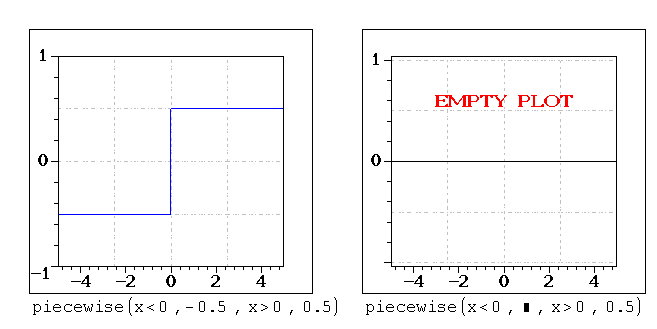
a:=plot(0, x=-5..5, axes=boxed, color=black, labels=["",""], tickmarks=[3,3]):t := textplot([0,0.5,`EMPTY PLOT`],align=ABOVE, color=red, font=[COURIER,14]):c:=coordplot(rectangular, [-5..5, -1..1], color=[gray,gray], linestyle=[7,7], grid=[5,5]):display([a,c,t]);
quit:
There are empty tmp files in the tmp dir:
tmp59BF.tmp
tmp5A0F.tmp
[MATH]`in`
x^2+y^2+z^2)-1[/MATH]but expected:
[MATH]sys(el(`in`;1);el(`in`;2);2;1):sys((x^2+y^2+z^2)-1;0;2;1)[/MATH]
we get: `in`[1]="" , `in`[2]="" - empty values (because it is not a system) and `in`=(x^2+y^2+z^2)-1 (but is missing in script)
Must be:
27.05.2013 12:54:58 [->] C:\Temp\tmpBFA.tmp:
interface(quiet=true);
with(linalg):with(inttrans):with(plots):
plotsetup(gif, plotoutput="C:\\Temp\\tmpBFB.gif", plotoptions=`height=387,width=392`);
F:=implicitplot3d( (x^2+y^2+z^2)-1=0, x=-2..2, y=-2..2, z=-2..2, grid=[30,30,30],
style=patchnogrid ):
G:=plot3d(0, x=-2..2, y=-2..2, style=patch, color=white):
display({F,G}, orientation=[20,60], axes=box, lightmodel=`light2`,
projection=`normal`, labels=["X","Y","Z"], scaling=constrained,
tickmarks=[4,4,4] );
quit:
This is normal.ЦитатаThere are empty tmp files in the tmp dir:
tmp59BF.tmp
tmp5A0F.tmp
- Новые сообщения
- Нет новых сообщений