Maple Tools - Symbolic engine for SMath Studio. - Messages
#121 Posted: 5/24/2013 5:33:52 PM

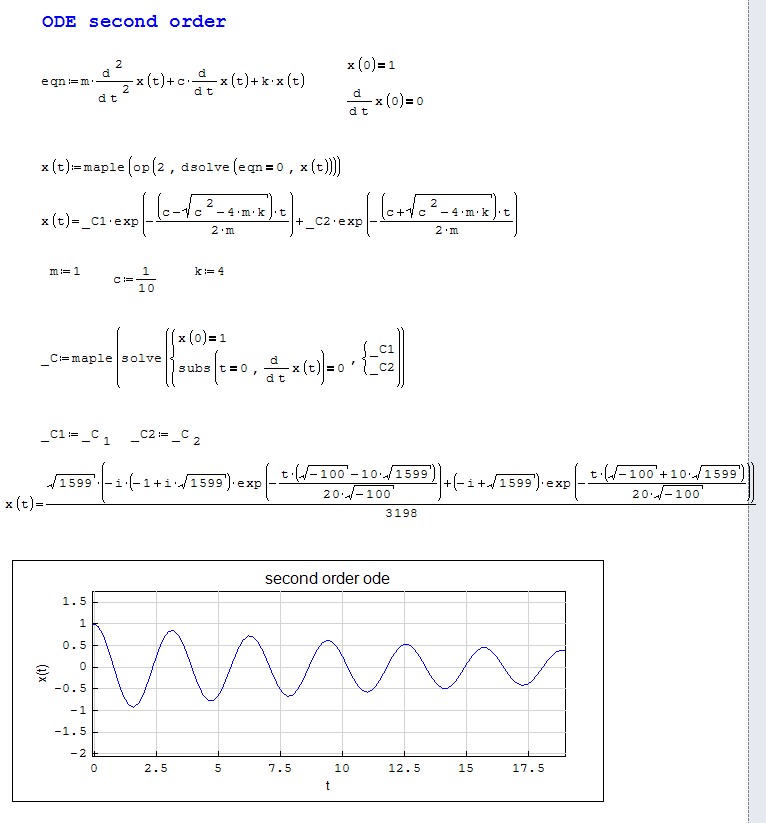
First and second order ODE examples.

I do not know how to solve them in one step like. How to put sets - {} in the command?
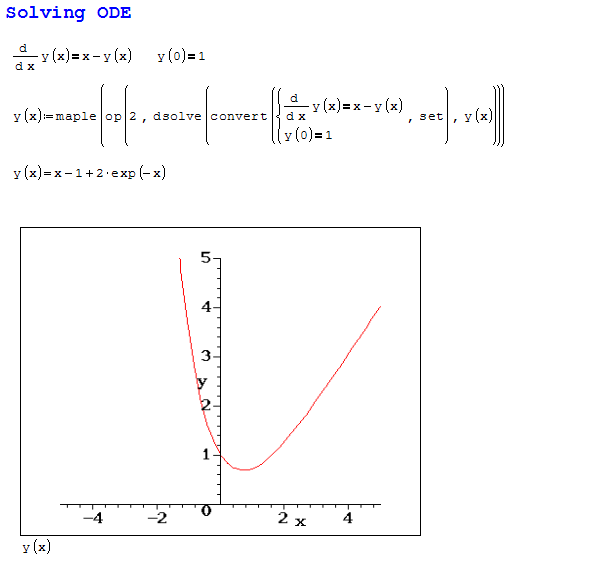
>dsolve({D(y)(x)=x-y,y(0)=1},y(x))
Could someone give some help?
Regards,
Radovan
ode2.sm (13.69 KiB) downloaded 1349 time(s).
I do not know how to solve them in one step like. How to put sets - {} in the command?
>dsolve({D(y)(x)=x-y,y(0)=1},y(x))
Could someone give some help?
Regards,
Radovan
ode2.sm (13.69 KiB) downloaded 1349 time(s).
When Sisyphus climbed to the top of a hill, they said: "Wrong boulder!"
#122 Posted: 5/24/2013 7:54:08 PM

Updated. The document can not be saved. I don't know why.
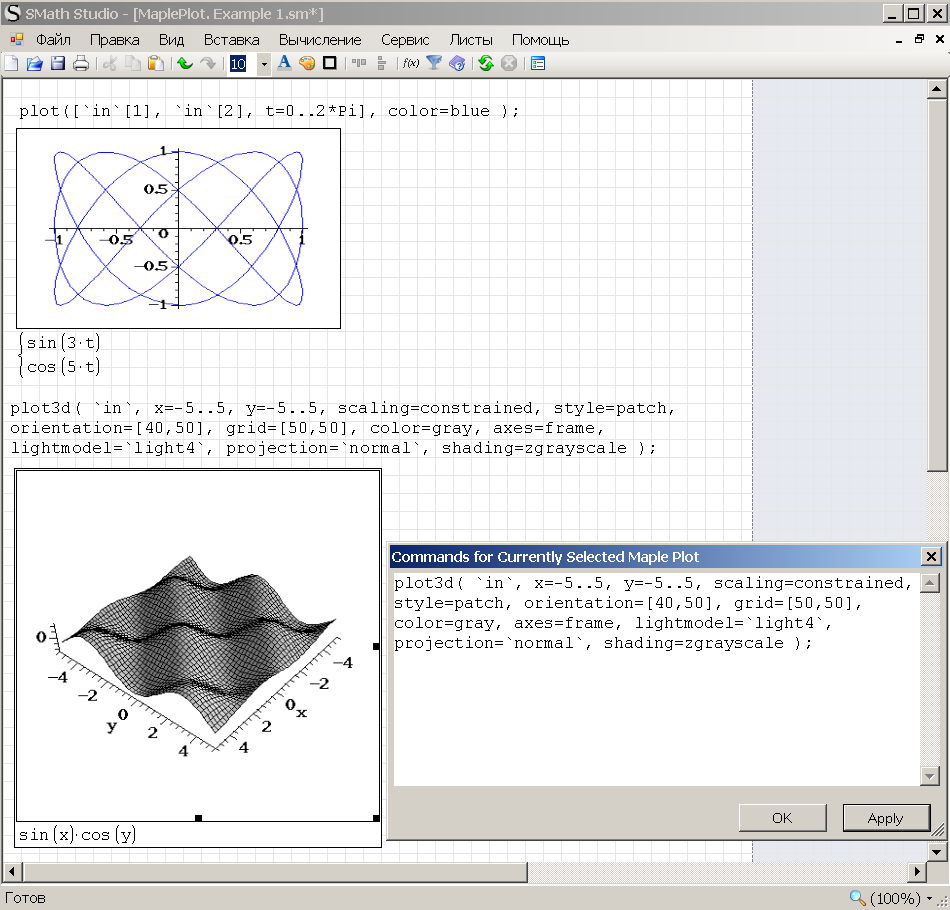
plot([`in`[1], `in`[2], t=0..2*Pi], color=blue );
plot3d( `in`, x=-5..5, y=-5..5, scaling=constrained, style=patch,
orientation=[40,50], grid=[50,50], color=gray, axes=frame,
lightmodel=`light4`, projection=`normal`, shading=zgrayscale );
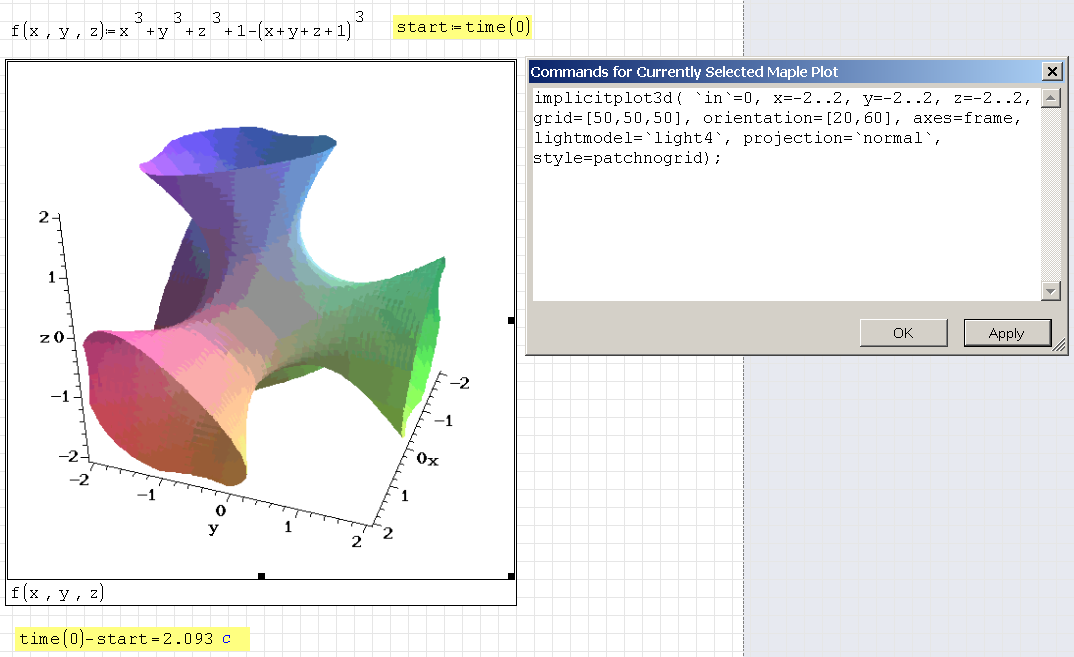
implicitplot3d( `in`=0, x=-2..2, y=-2..2, z=-2..2, grid=[50,50,50], orientation=[20,60],
axes=frame, lightmodel=`light4`, projection=`normal`, style=patchnogrid);
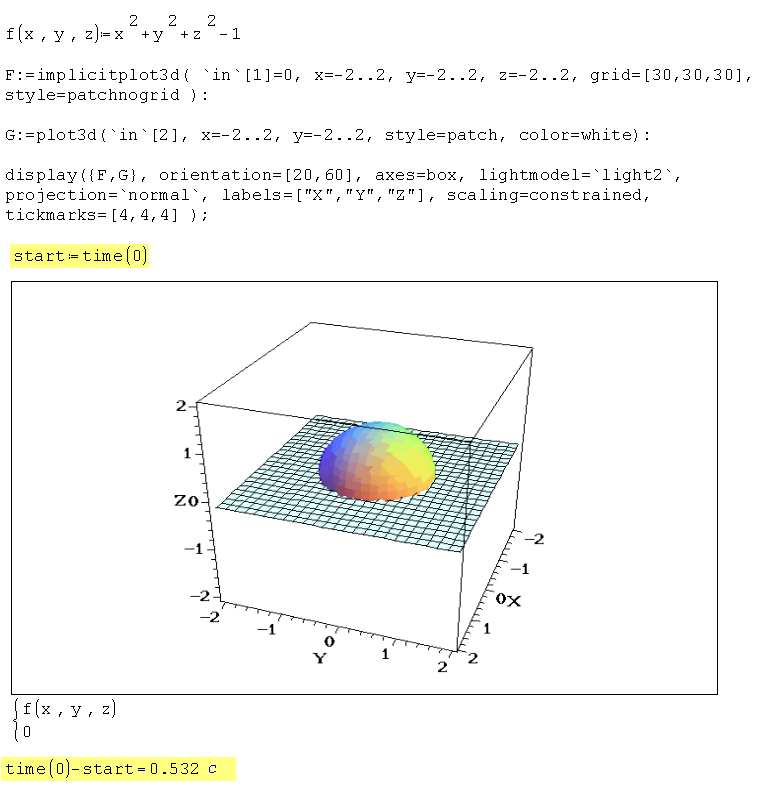
F:=implicitplot3d( `in`[1]=0, x=-2..2, y=-2..2, z=-2..2, grid=[30,30,30],
style=patchnogrid ):
G:=plot3d(`in`[2], x=-2..2, y=-2..2, style=patch, color=white):
display({F,G}, orientation=[20,60], axes=box, lightmodel=`light2`,
projection=`normal`, labels=["X","Y","Z"], scaling=constrained,
tickmarks=[4,4,4] );
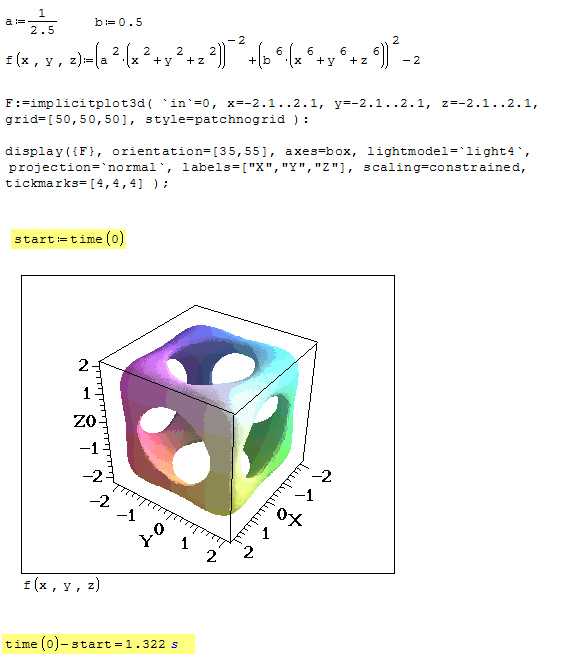
[MATH]f(x;y;z) a^2*(x^2+y^2+z^2))^{-2}+(b^8*(x^8+y^8+z^8))^4-2[/MATH]
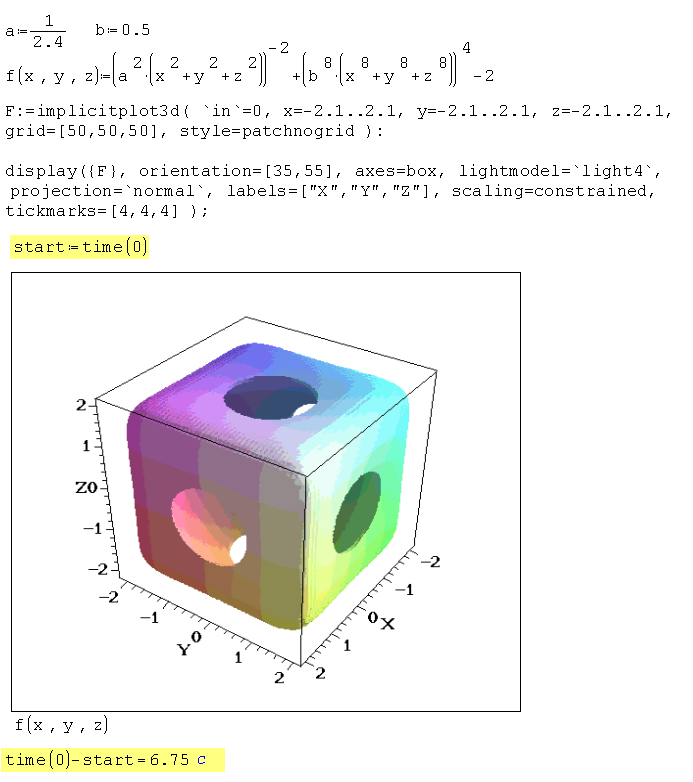
F:=implicitplot3d( `in`=0, x=-2.1..2.1, y=-2.1..2.1, z=-2.1..2.1,
grid=[50,50,50], style=patchnogrid ):
display({F}, orientation=[35,55], axes=box, lightmodel=`light4`,
projection=`normal`, labels=["X","Y","Z"], scaling=constrained,
tickmarks=[4,4,4] );
plot([`in`[1], `in`[2], t=0..2*Pi], color=blue );
plot3d( `in`, x=-5..5, y=-5..5, scaling=constrained, style=patch,
orientation=[40,50], grid=[50,50], color=gray, axes=frame,
lightmodel=`light4`, projection=`normal`, shading=zgrayscale );
implicitplot3d( `in`=0, x=-2..2, y=-2..2, z=-2..2, grid=[50,50,50], orientation=[20,60],
axes=frame, lightmodel=`light4`, projection=`normal`, style=patchnogrid);
F:=implicitplot3d( `in`[1]=0, x=-2..2, y=-2..2, z=-2..2, grid=[30,30,30],
style=patchnogrid ):
G:=plot3d(`in`[2], x=-2..2, y=-2..2, style=patch, color=white):
display({F,G}, orientation=[20,60], axes=box, lightmodel=`light2`,
projection=`normal`, labels=["X","Y","Z"], scaling=constrained,
tickmarks=[4,4,4] );
[MATH]f(x;y;z)
a^2*(x^2+y^2+z^2))^{-2}+(b^8*(x^8+y^8+z^8))^4-2[/MATH]F:=implicitplot3d( `in`=0, x=-2.1..2.1, y=-2.1..2.1, z=-2.1..2.1,
grid=[50,50,50], style=patchnogrid ):
display({F}, orientation=[35,55], axes=box, lightmodel=`light4`,
projection=`normal`, labels=["X","Y","Z"], scaling=constrained,
tickmarks=[4,4,4] );
Russia ☭ forever, Viacheslav N. Mezentsev
#123 Posted: 5/25/2013 3:50:17 AM
WroteI do not know how to solve them in one step like. How to put sets - {} in the command?
>dsolve({D(y)(x)=x-y,y(0)=1},y(x))
Could someone give some help?

Russia ☭ forever, Viacheslav N. Mezentsev
#124 Posted: 5/25/2013 5:52:17 AM
Aha,...convert() was the magic word. Thank you 
Strange, but this one was the only one successful
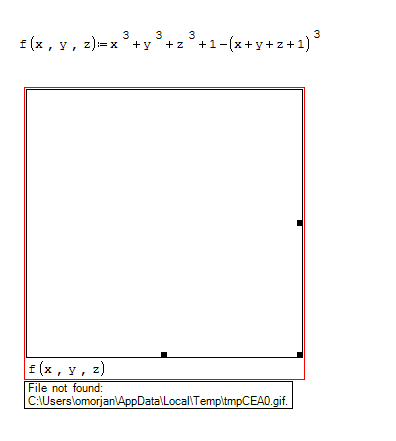
My other attempts in making plots and reproducing your pictures, issued an error about missing gif file in tmp folder. See the picture please
The problem of not saving pictures and SMat crash still remained.
Regards,
Radovan
Strange, but this one was the only one successful
My other attempts in making plots and reproducing your pictures, issued an error about missing gif file in tmp folder. See the picture please
The problem of not saving pictures and SMat crash still remained.
Regards,
Radovan
When Sisyphus climbed to the top of a hill, they said: "Wrong boulder!"
#125 Posted: 5/25/2013 6:08:25 AM
Show me the log file: mvr5.txt.
Russia ☭ forever, Viacheslav N. Mezentsev
#126 Posted: 5/25/2013 6:19:05 AM
WroteShow me the log file: mvr5.txt.
Here it is. If you want me something in particular to try, just let me know.
Regards,
Radovan
mvr5.txt (192.04 KiB) downloaded 1048 time(s).
When Sisyphus climbed to the top of a hill, they said: "Wrong boulder!"
#127 Posted: 5/25/2013 6:40:59 AM
This one is after deleting mvr5.txt and trying to make a parametric 3dplot
When Sisyphus climbed to the top of a hill, they said: "Wrong boulder!"
#128 Posted: 5/25/2013 6:59:09 AM
WroteWroteShow me the log file: mvr5.txt.
Here it is. If you want me something in particular to try, just let me know.
Regards,
Radovan
Radovan, you have to change the maple-commands for each graph. In your example these commands are set incorrectly. I specifically show the commands. They need to be inserted into the settings form, as showed above.
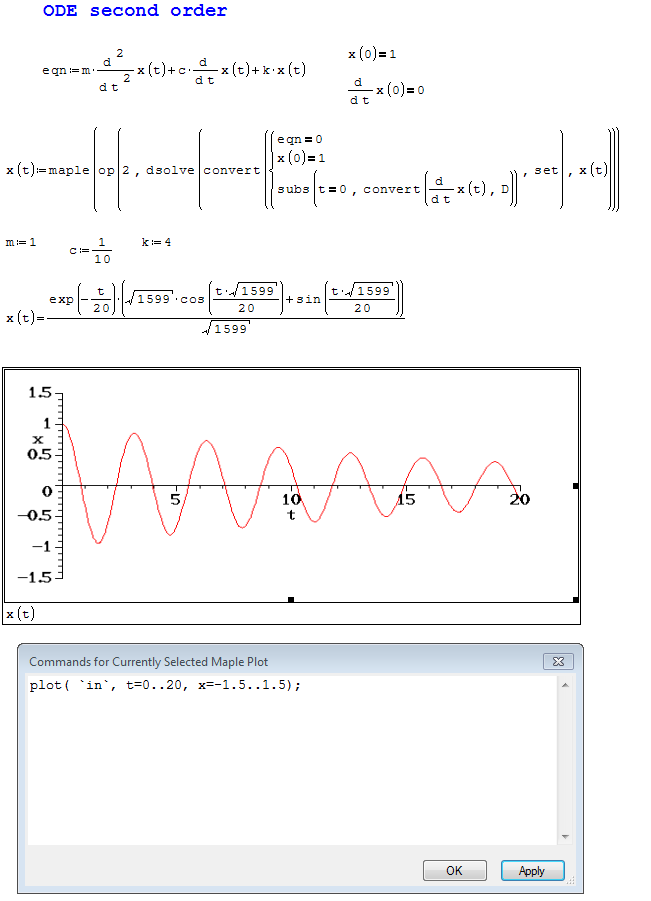
1) Try this:
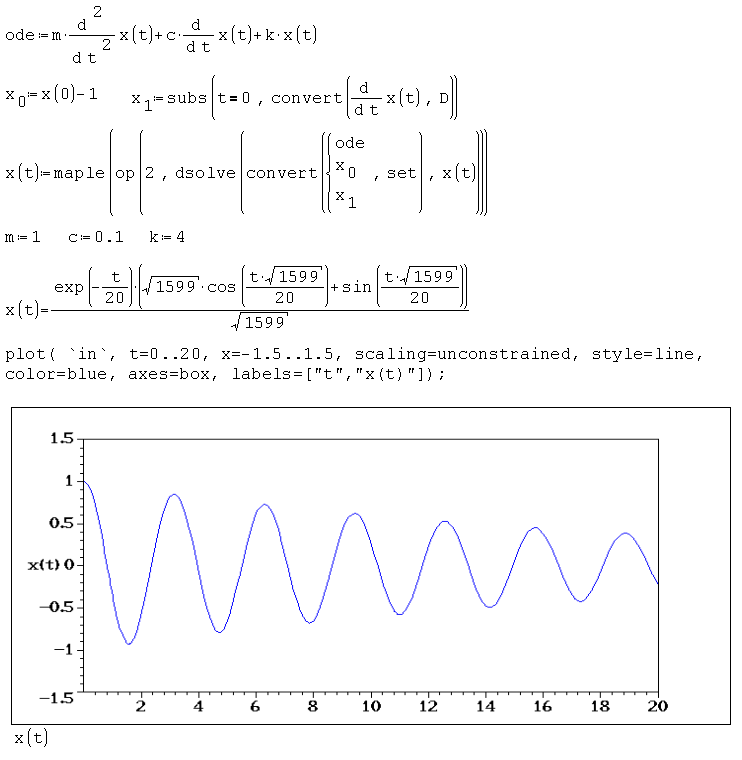
a := plot( `in`, t=0..20, x=-1.5..1.5, scaling=unconstrained, style=line,
color=blue, axes=box, labels=["t","x(t) "]):
b := coordplot(rectangular, [0..20, -1.5..1.5], linestyle=[7,7],
color=[gray,gray]):
display([a,b]);
2) projection=`normal must be projection=`normal`
Russia ☭ forever, Viacheslav N. Mezentsev
#129 Posted: 5/25/2013 8:04:10 AM
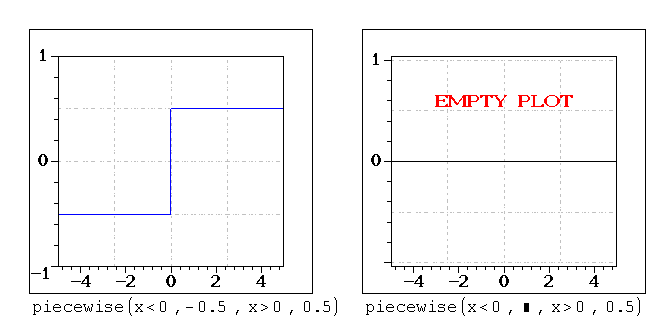
I tried your suggestion (just copy/paste) and calculation take quite long (did not wait for it to finish). Just used the simple one, and it worked (the first picture). It is good enough for me .
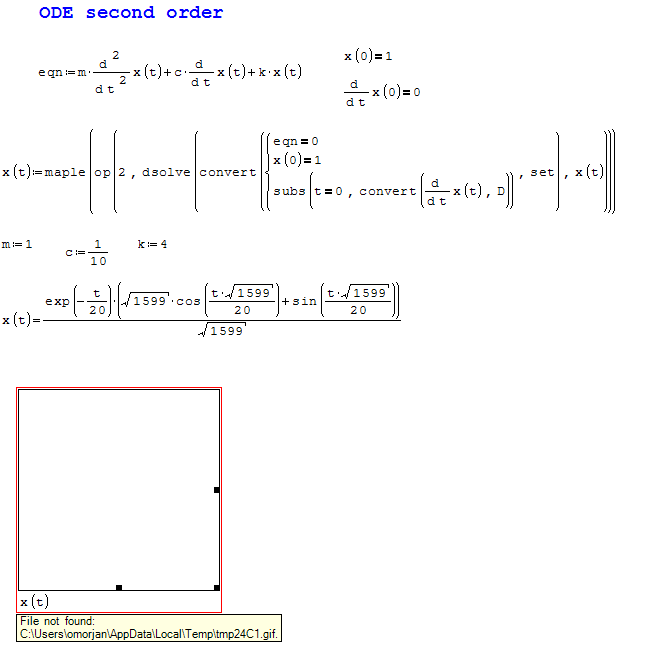
Tried one of your examples, and typed carefully as much as I could. I did not see any mistake - but the plot did not appear (the second picture)

Regards,
Radovan
mvr5.txt (265.75 KiB) downloaded 1115 time(s).
.Tried one of your examples, and typed carefully as much as I could. I did not see any mistake - but the plot did not appear (the second picture)
Regards,
Radovan
mvr5.txt (265.75 KiB) downloaded 1115 time(s).
When Sisyphus climbed to the top of a hill, they said: "Wrong boulder!"
#130 Posted: 5/25/2013 8:14:41 AM
Try to add with(plots): to with.inc:
Quotewith(linalg):with(inttrans):with(plots):
Russia ☭ forever, Viacheslav N. Mezentsev
#131 Posted: 5/25/2013 8:26:25 AM
WroteTry to add with(plots): to with.inc:
Quotewith(linalg):with(inttrans):with(plots):
It worked
. What was the catch?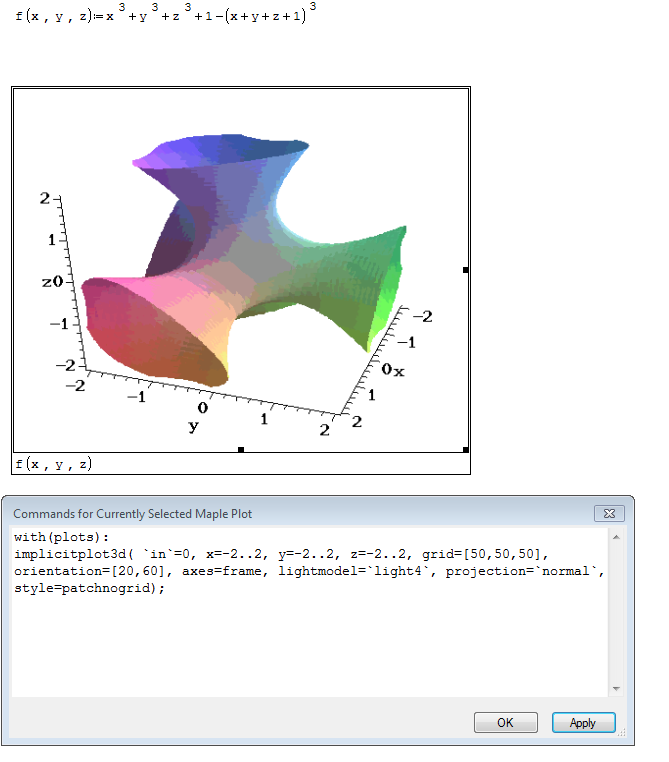
When Sisyphus climbed to the top of a hill, they said: "Wrong boulder!"
#132 Posted: 5/25/2013 12:26:54 PM
When Sisyphus climbed to the top of a hill, they said: "Wrong boulder!"
1 users liked this post
Вячеслав Мезенцев 5/25/2013 7:39:00 PM
#133 Posted: 5/25/2013 7:40:31 PM
MaplePlot updated. Small imprоvements.
Russia ☭ forever, Viacheslav N. Mezentsev
1 users liked this post
Radovan Omorjan 5/26/2013 3:00:00 AM
#134 Posted: 5/26/2013 2:59:31 AM
Just to confirm. The EMPTY PLOT is now working fine. No crash of SMath at the plot inserting
When Sisyphus climbed to the top of a hill, they said: "Wrong boulder!"
#135 Posted: 5/26/2013 4:20:20 AM
Hello,
Heartily please for the prompt, how to check in Maple that two expressions are to themselves equal. For example whether the expression under variable a is such alone as the expression under variable b?
Regards,
Janusz
Heartily please for the prompt, how to check in Maple that two expressions are to themselves equal. For example whether the expression under variable a is such alone as the expression under variable b?
Regards,
Janusz
#136 Posted: 5/26/2013 6:26:32 AM
WroteHeartily please for the prompt, how to check in Maple that two expressions are to themselves equal. For example whether the expression under variable a is such alone as the expression under variable b?
I do not use maple to much (it is interesting and a fun using it in SMath
) , and someone else might give you a better solution - but this should work[MATH=eng]e1
a^2-1)*1/sqrt(a)[/MATH][MATH=eng]e2
b-1)*(b+1)/sqrt(b)[/MATH][MATH=eng]maple(simplify(subs(a≡b,e1)-e2))=0[/MATH]
Regards,
Radoavn
When Sisyphus climbed to the top of a hill, they said: "Wrong boulder!"
#137 Posted: 5/26/2013 7:32:54 AM
Hi Radoavn,
Thank you, interesting solution, will try out it.
Regards,
Janusz
Thank you, interesting solution, will try out it.
Regards,
Janusz
#138 Posted: 5/27/2013 1:10:51 AM
Updated. Still can't save region.
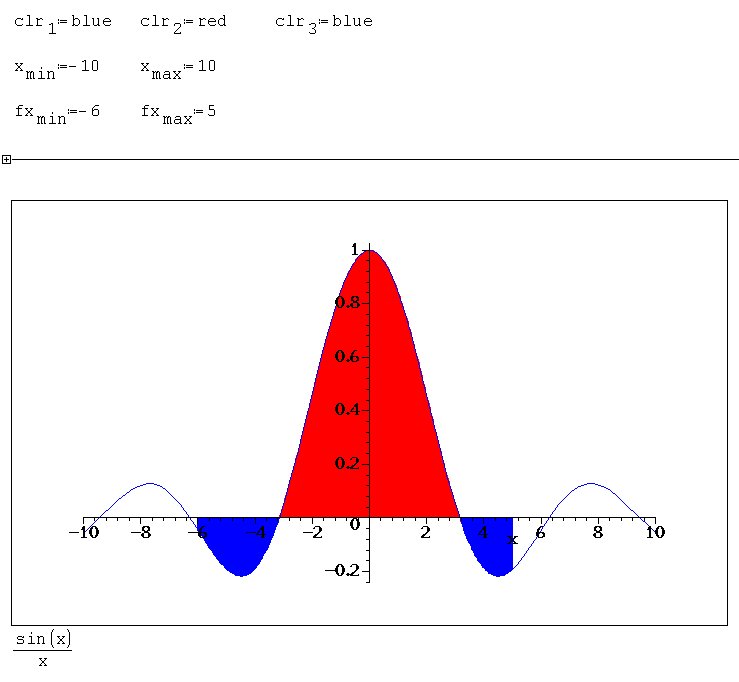
FillCurve := proc(f,a,b,am,bm)
local i,n,x1,x2,y1,y2,A,d:
n := 200;
d := ( b - a ) / n;
x2 := a;
for i from 1 to n do
x1 := evalf( x2 );
x2 := evalf( a + i * d );
y1 := evalf( f( x1 ) );
y2 := evalf( f( x2 ) );
if ( y1 > 0 ) then
A[i] := polygonplot( [ [x1, 0], [x1, y1], [x2, y2], [x2, 0] ], color=`::clr.2`, style=patchnogrid );
else
A[i] := polygonplot( [ [x1, 0], [x1, y1], [x2, y2], [x2, 0] ], color=`::clr.3`, style=patchnogrid );
fi;
od:
display( [ plot( f(x), x = am..bm, color=`::clr.1`, discont=true ), seq( A[i], i=1..n ) ] );
end:
FillCurve(x->`in`,`::fx.min`,`::fx.max`,`::x.min`,`::x.max`);
MaplePlot. Example 8.sm (4.9 KiB) downloaded 1380 time(s).
Russia ☭ forever, Viacheslav N. Mezentsev
1 users liked this post
Radovan Omorjan 5/27/2013 4:21:00 AM
#139 Posted: 5/27/2013 2:22:01 AM
Thanks for the update.
I have still trouble with the basics. Example 2 does not work.
Here is what the log file says:
There are empty tmp files in the tmp dir:
tmp59BF.tmp
tmp5A0F.tmp
I have still trouble with the basics. Example 2 does not work.
Here is what the log file says:
27.05.2013 08:10:59 [->] (x^2+y^2+z^2)-1
27.05.2013 08:10:59 [->] D:\tmp\tmp59BE.tmp:
interface(quiet=true);
with(linalg):with(inttrans):with(plots):
plotsetup(gif, plotoutput="D:\\tmp\\tmp59BF.gif", plotoptions=`height=409,width=457`);
F:=implicitplot3d( =0, x=-2..2, y=-2..2, z=-2..2, grid=[30,30,30],
style=patchnogrid ):
G:=plot3d(, x=-2..2, y=-2..2, style=patch, color=white):
display({F,G}, orientation=[20,60], axes=box, lightmodel=`light2`,
projection=`normal`, labels=["X","Y","Z"], scaling=constrained,
tickmarks=[4,4,4] );
quit:
27.05.2013 08:10:59 [->] D:\tmp\tmp59FE.tmp:
interface(quiet=true);
with(linalg):with(inttrans):with(plots):
plotsetup(gif, plotoutput="D:\\tmp\\tmp5A0F.gif", plotoptions=`height=409,width=457`);
a:=plot(0, x=-5..5, axes=boxed, color=black, labels=["",""], tickmarks=[3,3]):t := textplot([0,0.5,`EMPTY PLOT`],align=ABOVE, color=red, font=[COURIER,14]):c:=coordplot(rectangular, [-5..5, -1..1], color=[gray,gray], linestyle=[7,7], grid=[5,5]):display([a,c,t]);
quit:
There are empty tmp files in the tmp dir:
tmp59BF.tmp
tmp5A0F.tmp
Technische Mechanik mit SMath Studio: https://link.springer.com/book/10.1007/978-3-658-50592-9
#140 Posted: 5/27/2013 3:07:10 AM
In your example:
[MATH]`in`x^2+y^2+z^2)-1[/MATH]
but expected:
[MATH]sys(el(`in`;1);el(`in`;2);2;1):sys((x^2+y^2+z^2)-1;0;2;1)[/MATH]
we get: `in`[1]="" , `in`[2]="" - empty values (because it is not a system) and `in`=(x^2+y^2+z^2)-1 (but is missing in script)
Must be:

[MATH]`in`
x^2+y^2+z^2)-1[/MATH]but expected:
[MATH]sys(el(`in`;1);el(`in`;2);2;1):sys((x^2+y^2+z^2)-1;0;2;1)[/MATH]
we get: `in`[1]="" , `in`[2]="" - empty values (because it is not a system) and `in`=(x^2+y^2+z^2)-1 (but is missing in script)
Must be:
27.05.2013 12:54:58 [->] sys({((x^2+y^2+z^2)-1)},0,2,1)
27.05.2013 12:54:58 [->] C:\Temp\tmpBFA.tmp:
interface(quiet=true);
with(linalg):with(inttrans):with(plots):
plotsetup(gif, plotoutput="C:\\Temp\\tmpBFB.gif", plotoptions=`height=387,width=392`);
F:=implicitplot3d( (x^2+y^2+z^2)-1=0, x=-2..2, y=-2..2, z=-2..2, grid=[30,30,30],
style=patchnogrid ):
G:=plot3d(0, x=-2..2, y=-2..2, style=patch, color=white):
display({F,G}, orientation=[20,60], axes=box, lightmodel=`light2`,
projection=`normal`, labels=["X","Y","Z"], scaling=constrained,
tickmarks=[4,4,4] );
quit:
This is normal.QuoteThere are empty tmp files in the tmp dir:
tmp59BF.tmp
tmp5A0F.tmp
Russia ☭ forever, Viacheslav N. Mezentsev
1 users liked this post
Martin Kraska 5/27/2013 3:50:00 PM
- New Posts
- No New Posts