Sorting by distance to the view point a mesh - Сообщения
Sometimes the figure get bad, with some polygons and shows some polygons that should be hidden.
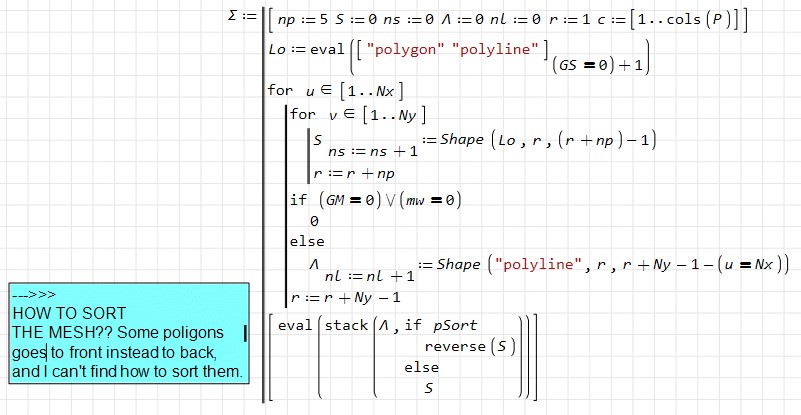
My question is how can I know which polygons goes to front and which others go to back?
pPlotQuestion.sm (57,15 КиБ) скачан 973 раз(а).
Best regards.
Alvaro.
Laurent
https://www.geogebra.org/u/lohabithi
I guess that you are talking about the procedure for hidden line removal in displaying a function of 2 variable or I am not understanding correctly your question? If yes , this is a typical topic of Computer graphic and it is explained in the classical books about this topic.
If you need these details I can find in my library ( very old library ) these informations and send you a pseudo-code for doing that even if this task is already done in the 3d native module of Smath or in the Maxima plug in but obviously this internal details are hidden and we see just the final result.
Best regards
Franco

WroteTHe same technique could be applied for contour lines and vector field plots.
This sort of thing should be done with special plugins.
We need a group of active users. These users could select for example the 3 most needed plugins. Next, they should ask the rest of the users to collect the amount to sponsor the development team. This team can be hired from a freelance site or similar place. We will provide them with the source code, documentation and an introductory programming course.
WroteHi Alvaro,
I guess that you are talking about the procedure for hidden line removal in displaying a function of 2 variable or I am not understanding correctly your question? If yes , this is a typical topic of Computer graphic and it is explained in the classical books about this topic.
If you need these details I can find in my library ( very old library ) these informations and send you a pseudo-code for doing that even if this task is already done in the 3d native module of Smath or in the Maxima plug in but obviously this internal details are hidden and we see just the final result.
Best regards
Franco
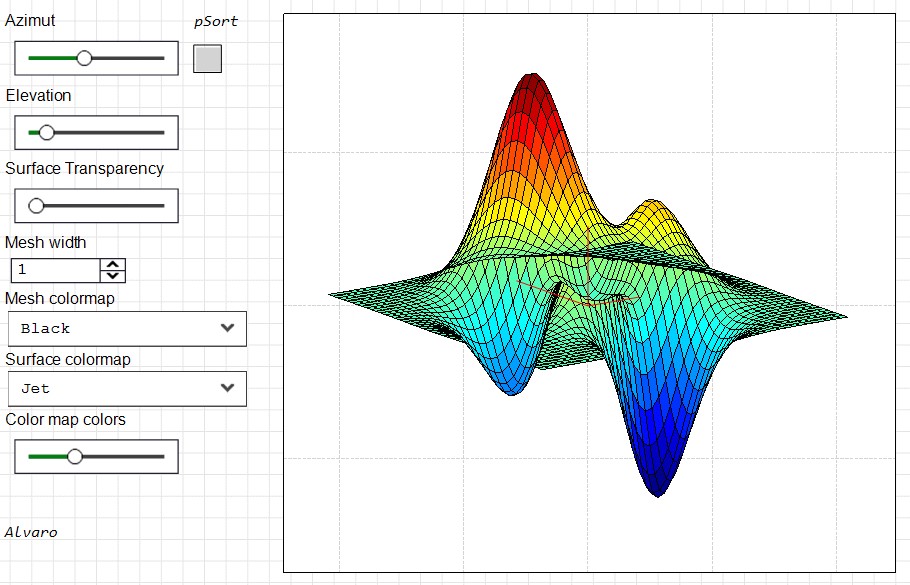
Hi Franco. Thanks for the offer. Actually the detail that I cannot solve can be seen in the following two figures:
Bad sort:
good sort
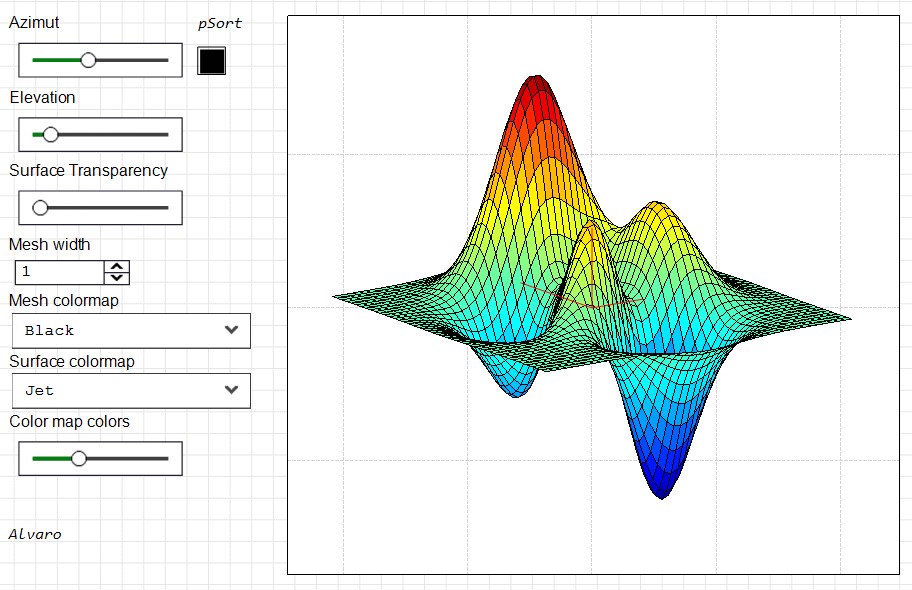
The method to order what I use is very rustic, and surely a criterion is required to order each and every one of the polygons, but at least it almost always gives good results, except that I would like to have some geometric criteria to decide when to invert the order. If it is with a single formula, better
I don't know how to order the polygons to be drawn so that the ones closest to the video are in front, and the others are behind, either because I can't find that focal point, or because it is really only necessary to pay attention to the matrix turn, or because perhaps it is something more complicated, in which case I would no longer be interested, since it is an application to show basic and not very advanced techniques for calculation with some programming, thinking about its applications to better understand and handle other software for industrial design, stress calculation and the like that use finite element analysis methods on meshes.
Best regards.
Alvaro.
WroteWroteTHe same technique could be applied for contour lines and vector field plots.
This sort of thing should be done with special plugins.
We need a group of active users. These users could select for example the 3 most needed plugins. Next, they should ask the rest of the users to collect the amount to sponsor the development team. This team can be hired from a freelance site or similar place. We will provide them with the source code, documentation and an introductory programming course.
Hi. That's a great project. Keep us informed if these groups are integrated. It could also be interesting to develop groups according to engineering: mechanical, electrical power, electronics, telecommunications, civil, chemical, process chemistry, food chemistry, etc. And do not forget other professions such as medicine (statistics!) or radiologists (imaging), personnel who have to calculate doses or mixtures in the laboratory, etc. Nor should we forget the technical staff. The mathematics may be the same, but the way in which it is necessary to present and perform the calculations can vary a lot and surely there are groups that are interested in supporting the development of these types of applications from SMath, either with plugins or in the development of worksheets specialized in these topics.
Best regards.
Alvaro.
if you can send me the data to plot I'll try to see what I am able to do ( within the next 3 months I'll retire ).
I need to re-study the hidden line removal algorithm (see attached paper https://apps.dtic.mil/sti/pdfs/ADA124348.pdf, we are in the early years of Computer Graphics ) and if I'll be able to do something it will be just for educational purposes.
I imagine that you refer both to data generated from a 2 dimensional function of from discrete data collected in a bidimensional matrix.
Best regards
Franco
Anderson3.pdf (537,12 КиБ) скачан 1676 раз(а).
Best regards
Alvaro.
WroteThanks for the references. Yesterday not, but right now manually reversing sorting looks good after the reading ... at least it gives enough good results in a los of cases. It seems that there are a some kind of procedure in matlab too for "2D plot" 3D figures, but they use 4 matrices and homogeneous coordinates (here and here). Just when I just reduced the rotation matrix from 3 to 2 dimensions I am not going to increase it to 4. That would be unfair.
Hola Alvaro !
Do you mean project 3D on 2D, preserving rotation and else ?
In Smath, it is native from the 3D construction, in fact a 4D
much different than Mathcad, maybe Matlab too.
Read first ... 2D parametric explorer.
In the attached, more delicious shapes [Breather, Horn, Meduse ...]
The most common rotation systems [Quaternions, Parametric, Composite, Euler]
Cheers ... Jean
Rotate 3D TREASURY_2 Parametric Explorer.sm (20,8 КиБ) скачан 984 раз(а).
Rotate 3D TREASURY_00 Vector Circulation.sm (51,66 КиБ) скачан 1064 раз(а).
Rotate 3D TREASURY_4 Quaternions MODULO Matrix.sm (50,68 КиБ) скачан 974 раз(а).
Rotate 3D TREASURY_3 Isometric.sm (57,01 КиБ) скачан 957 раз(а).
Rotate 3D TREASURY_5 Quaternions MODULO Explorer.sm (71,97 КиБ) скачан 1037 раз(а).
Rotate 3D TREASURY_0 Axes Systems.sm (118,18 КиБ) скачан 1035 раз(а).
Rotate 3D TREASURY_4 Quaternions MODULO.sm (378,23 КиБ) скачан 1032 раз(а).
WroteThat's beautiful! Thanks. I am more and more using geogebra in combination with Smath, geogebra for quick prototyping, and Smath for a final, more self-explaining and more presentable sheet. But still we need a bit more "graphic-friendly" procedures and methods in Smath.
Laurent
https://www.geogebra.org/u/lohabithi
I had not had time to see your drawings in Geogebra, they really look great. In my land we don't have bamboo (we have something else: tacuara), but we do have ... land. Or clay, rather.
We had a demigod that he taught us before he went to use it: Eladio Dieste. If you google his name in images, his constructions based on ruled surfaces, and with construction procedures that he invented on the fly. Maybe this link interests you: https://www.geogebra.org/m/V3d7E2SR
This construction has always impressed me
Best regards.
Alvaro.
- Новые сообщения
- Нет новых сообщений