X-Y Plot for electrical resistance - Trying to plot electrical resistance - Сообщения
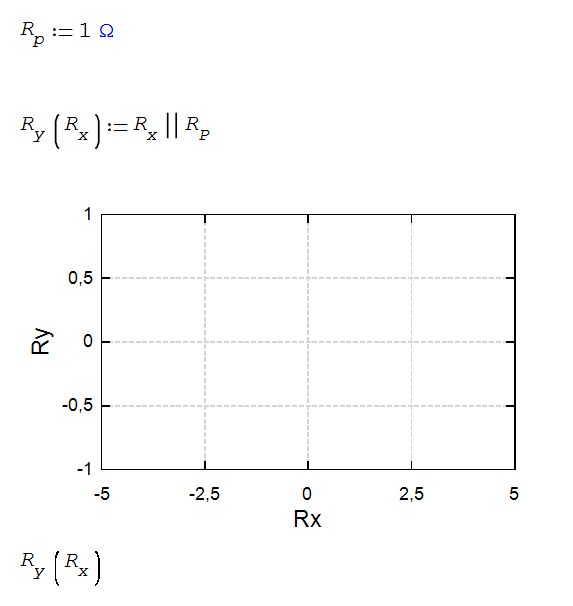
Can anyone help me plot this?
Usually you shouldn't use units while plotting.
For information, this includes most numeric solver functions too.
Regards
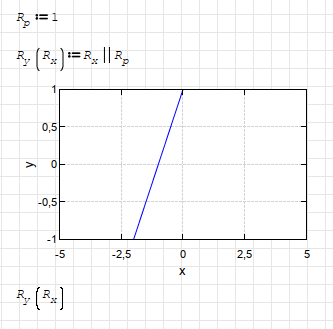
Try to eliminate or add them in the input data.
It is to avoid them being used in plot.
Or to avoid conflict between unit-ed numbers and not unit-ed.
When you use Rx in your function, it can't be EEL_par with 1 ohm.
Plot try to use Rx as an number not a unit added number.
You either add unit to Rx or do opposite.
Opposite is eliminating all units of other variables.
Regards
Also, how is it possible to only plot (or "stem" as it is called in Matlab ) integer values?
WroteThanks, this makes total sense.
Also, how is it possible to only plot (or "stem" as it is called in Matlab ) integer values?
Maybe I chose a wrong word to describe it, shall edit.
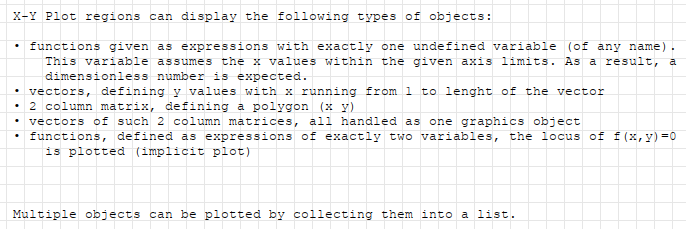
It will plot not only integers, numbers actually.
But plot expect them to be dimensionless.
Not just X-Y plot, built-in 2D plot also.
Regards
WroteOr if you will really need units;
Try to eliminate or add them in the input data.
It is to avoid them being used in plot.
Or to avoid conflict between unit-ed numbers and not unit-ed.
When you use Rx in your function, it can't be EEL_par with 1 ohm.
Plot try to use Rx as an integer not a unit added number.
You either add unit to Rx or do opposite.
Opposite is eliminating all units of other variables.
Regards
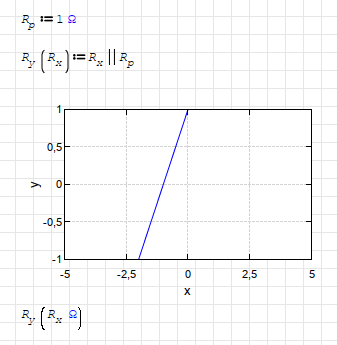
So how did you add the Ohm symbol under the plot? It won't let me add a unit there.
WroteSo how did you add the Ohm symbol under the plot? It won't let me add a unit there.
1 - Hit multiply after Rx;
2 - (Type W in place holder, place Ctrl+G) or (Click ohm from right pane);
3 - Placeholder shall appear, either double click or press tab to insert Ω as unit.
If you are not typing units after numbers, this is the way.
You can also type ' between step1 and step2.
Units can be typed or chosed with this way more quick.
This will directly open placeholder scroll menu.
Regards
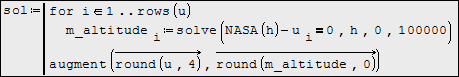
WroteAlso, how is it possible to only plot (or "stem" as it is called in Matlab ) integer values?
Altitude is plotted integers.
Solve INVERSE Recursive NASA.sm (13,76 КиБ) скачан 989 раз(а).
WroteAlso, how is it possible to only plot (or "stem" as it is called in Matlab ) integer values?
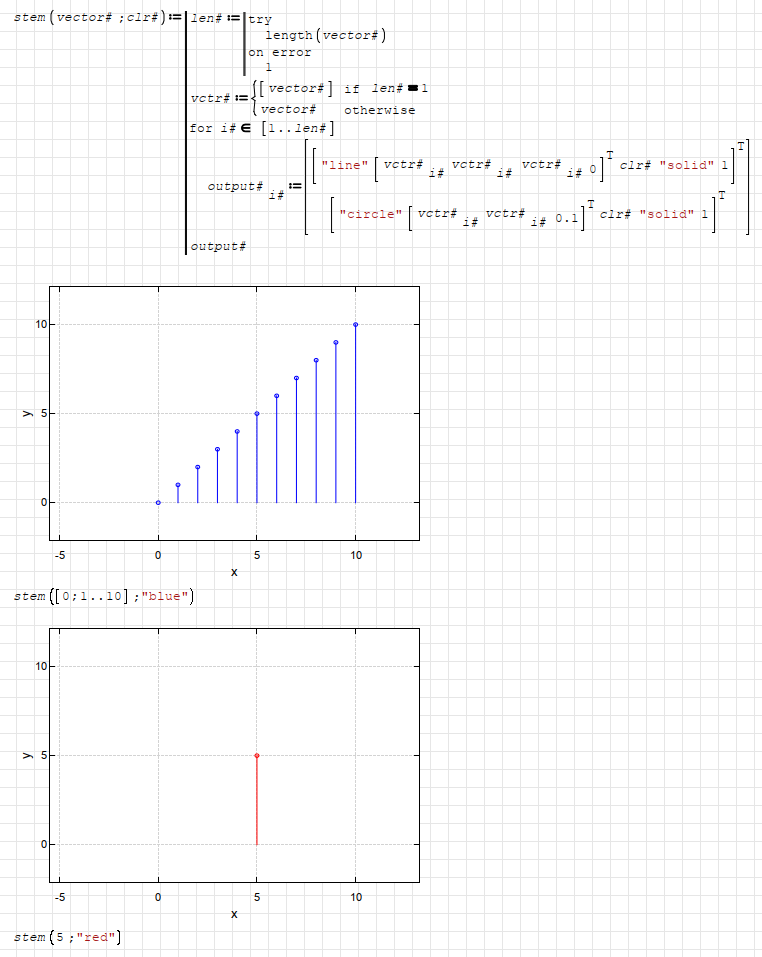
I don't know if there is a stem equivalent for smath plots.
But you can create your own function for that purpose.
Regards
stem.sm (8,62 КиБ) скачан 1002 раз(а).
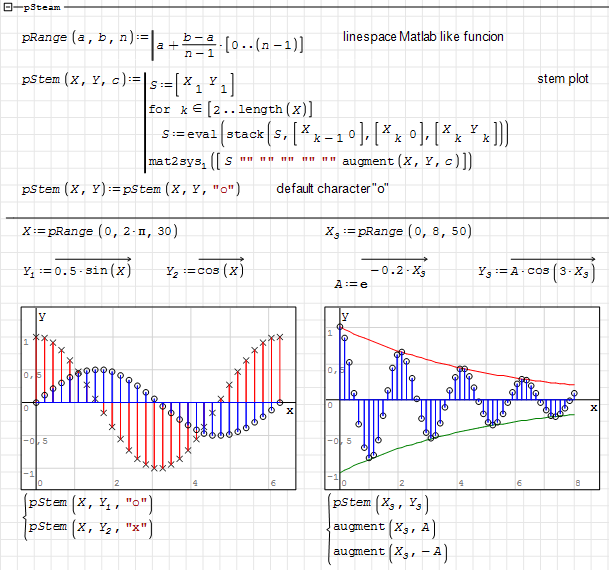
Here, integers are the X direction.
Eventually, easy for the Y direction as applicable.
2D Util Stem ANIM Laplace Diffusion.sm (21,6 КиБ) скачан 1063 раз(а).
You will have to dispose their position by hand.
2D Plot Setup Glyphes.sm (28,77 КиБ) скачан 951 раз(а).
- Новые сообщения
- Нет новых сообщений