1 страниц (4 вхождений)
function interval in plot - Сообщения
Hi, is it possible to set up interval for the function, which i want to figure in X-Y plot? For example with using if-else or something different. I need to figure only some interval but when i zoom in or zoom out the SMath will stop working.
Thank you for your help.
Thank you for your help.

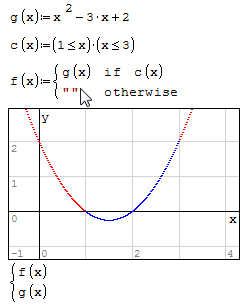
Yes, it is possible. You can find in the forum different examples like the one I attach to you but also with other modes like if-else.
Regards
sergio
[albumimg]1456[/albumimg]
Regards
sergio
[albumimg]1456[/albumimg]
Observe the blanking character "
1 страниц (4 вхождений)
- Новые сообщения
- Нет новых сообщений