How to draw bounding boxes - Сообщения
The only way I have figured out, is to create a text box filled with spaces and newlines and set color and bounding box to it. It helps me to group variables and organize notes. This approach is somewhat tedious. Is there a simpler way? Would it be a good idea to create such a plugin?
Highlight as you wish, click to border. All the parameters
in this example are active for the next project procedure.
For that special bracket: click in palette at right to get
the first pair, click on the lower place holder, press
coma, coma, coma ... to add more. Put more instructions
in a separate text box. Will that do ?
Jean
This is a rather nice possibility I haven't thought. Would it be difficult to make a plugin for a drag-to-resize box? This would give even more freedom.
Approach proposed by Jean is probably the most straight forward one.
If you insist on resizable bounding box (empty region) you can insert an image region, turn on the border, uncheck display input. This will LOOOK like what you are asking for, but will not have the desired functionality.
WroteThanks,
This is a rather nice possibility I haven't thought.
Would it be difficult to make a plugin for a drag-to-resize box?
This would give even more freedom.
Don't need a plugin, use the Insert => Picture => Create.
It plugs a box with handles ... stretche each direction.
To view the bounding box: click on the square in the menu,
slide over your collected stuff: text, image, equations ...
Click anywhere in that creation, the inside stuff disappears,
stretche with the handles, click away outside, bingo the
all creation is back.
This is another, actually rather functional trick. Yes, the Picture region plugin allows to paste pictures directly to the worksheet and scale them by dragging. When cutting single color area from the screen and pasting the picture to the worksheet, the functionality is very close to what I was thinking. The only problem in this approach is that you cannot put regions to the background in SMath. That means that if one wants to edit the regions inside the bounding box, one has to move the box away. Is there a way to define regions for "background"?
next some source image/reference, next your functions/equations/parameters/graphs ...
Your can finally frame a printable Smath page. What other gyzma can do more professional ?
Just different than Mathcad 11 but surely as presentable !
Cheers, Jean

WroteWould it be a good idea to create such a plugin?
AFAIK is not possible to create a plugin to draw hollow regions (BTW, was requested to me also for the snapshot region). This would require some new core features from the developer.
In addition to the suggestions above, you can create your own "horizontal line" and "vertical line" from any paint program (f.e. MS paint), "big enough" to be close to the page size to avoid resize artifacts), then you can copy and paste them in the worksheet and resize to the required size.
![2016-03-24 20_20_57-SMath Studio Desktop - [Page1_].png](/ru-RU/files/Download/F5C4Dp/2016-03-24-20_20_57-SMath-Studio-Desktop---[Page1_].png)
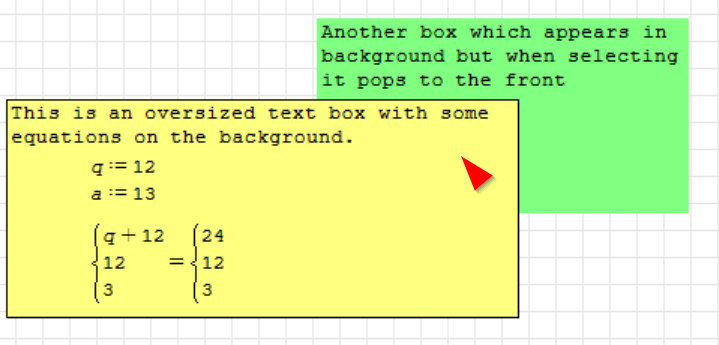
It seems that objects earlier in execution pipe (upper on the sheet) are selected first, but displayed on the background. Therefore if there exist overlapping objects, I cannot select the object which I see in the front.
The figure explains. If the boxes are arranged like in the picture and if I click with mouse the area marked with arrow, I select green box, which appears to be on the background. Why?
Wouldn't it be logical with other way round? Other way round would allow to create also bounding boxes with ease.
In Mathcad 11 you could create an hollow graph by pasting as Metafile.
Thus you could have a graph over any kind of image.
This functionality has been demonstrated and only used by myself.
Box.sm (10,32 КиБ) скачан 1108 раз(а).
2D Plot Range BOLEAN [Segments u,v,w...].sm (6,47 КиБ) скачан 907 раз(а).
You can Bolean blank any part of the trace plot.
Just post what you think you are after.
2D Plot Show_Hide.sm (9,27 КиБ) скачан 1123 раз(а).
It would be more logical when clicking things you see, they get activated.
For example, the equations in the yellow box are behind the box. One can see them, which is nice feature, but one cannot edit them (unless you drag the yellow box away).
It would be very handy and easy to play with bounding boxes if the equations "in" the box would be on top both visually, and also for selecting with mouse.
Wrote
For example, the equations in the yellow box are behind the box. One can see them, which is nice feature, but one cannot edit them (unless you drag the yellow box away).
It would be very handy and easy to play with bounding boxes if the equations "in" the box would be on top both visually, and also for selecting with mouse.
I don't know the design intent. Just want to mention that you don't need to drag away the background box. Exploit the fact that you can move the region focus using the keyboard. Just click one region and press TAB or Shift TAB or Arrow up and down. A region with focus is in the foreground and you can move it with the mouse (drag the border) or edit it's contents.
This is usually more convenient than to temporarily remove the covering region.
WroteI don't know the design intent.
IMHO; useless. The Valery Golden ratio was based on that Mathcad feature
"bring to front/send to back". The very same functionality is done in
Smath from some programming feature that weren't possible in Mathcad 11.
The orthogonal polynomials needs something of that sort, but much easier
to pre-initialize in visible construction.
Цитата
I don't know the design intent. Just want to mention that you don't need to drag away the background box. Exploit the fact that you can move the region focus using the keyboard. Just click one region and press TAB or Shift TAB or Arrow up and down. A region with focus is in the foreground and you can move it with the mouse (drag the border) or edit it's contents.
This is usually more convenient than to temporarily remove the covering region.
Thanks! The TAB trick is handy. I did not knew this (or forgot about it). It helps. However, it would be even easier it the focus would go automatically to the object displayed in the front. The focus order could follow the reverse execution order, it would be also logical.
- Новые сообщения
- Нет новых сообщений