1 страниц (10 вхождений)
ZedGraph problem with document - a function with an if in it won't plot. x not defined - Сообщения
The sample code shows what works and what doesn't. I think the issue is in zed_graph as 2D works. It stops working when the if is added to the function zedgraph example.sm (151,36 КиБ) скачан 1201 раз(а).
Seems that Zedgraph can't handle if(). It also fails at non-numeric or undefined values.
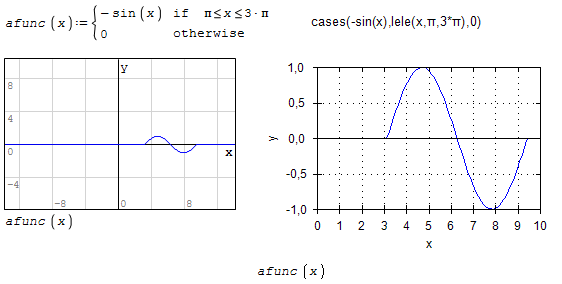
A workaround for if() is the use of cases() from Customfunctions plugin. It converts into a boolean expression, which can be handled by Zedgraph.
Suppressing parts of a curve by making it undefined doesn't work. You just can set it to zero.
I am not using Zedgraph. Even setting axes limits requires a lot of scrolling through option trees. XY-Plot is much better in that respect. For log plots I use Maxima Draw regions.
zedgraph%20example_Kr.sm (34,05 КиБ) скачан 1427 раз(а).
Technische Mechanik mit SMath Studio: https://link.springer.com/book/10.1007/978-3-658-50592-9
1 пользователям понравился этот пост
frapuano 22.12.2019 05:35:00
Thank you for your help.
WroteIt stops working when the if is added to the function
AFAIK, X_Y takes no kind of conditional.
Not needed in two counts:
1. It has axis limits from user
2. plot as data set.
zedgraph example [red].sm (148,78 КиБ) скачан 1030 раз(а).
Hi Jean
The example I gave was to highlight the issue. I am plotting protection functions, these are very much piecewise functions.
The example I gave was to highlight the issue. I am plotting protection functions, these are very much piecewise functions.
Hi mkraska
I really like the afunc syntax and I am sorry but Newbie I am. How did you get the if after -sin(x)
I really like the afunc syntax and I am sorry but Newbie I am. How did you get the if after -sin(x)
Hi mkraska
worked it out. types in cases; thank
worked it out. types in cases; thank
WroteHi Jean
The example I gave was to highlight the issue. I am plotting protection functions, these are very much piecewise functions.
There is no issue: you can plot contiguous pieces of same function,
or any selected pieces. You can have as many different functions
as you wish of both styles.
Please, revisit just new "2D plot Piecewise" in Samples.
Cheers ... Jean
Hi mkraska
I stuck with zedgraph,
curves_example.sm (60,24 КиБ) скачан 1202 раз(а).
I think the results looks pretty good, thanks again for your help and the custom functions.
Thanks Jean,
I really like mkraska's solution. It would be nice if "if" worked but anyway.
I stuck with zedgraph,
curves_example.sm (60,24 КиБ) скачан 1202 раз(а).
I think the results looks pretty good, thanks again for your help and the custom functions.
Thanks Jean,
I really like mkraska's solution. It would be nice if "if" worked but anyway.
WroteI'm stuck with zedgraph,
... freak here too.
Native Quick plot is as well educative.
curves_example Native QuickPlot.sm (88,78 КиБ) скачан 1220 раз(а).
1 страниц (10 вхождений)
- Новые сообщения
- Нет новых сообщений