Greetings,
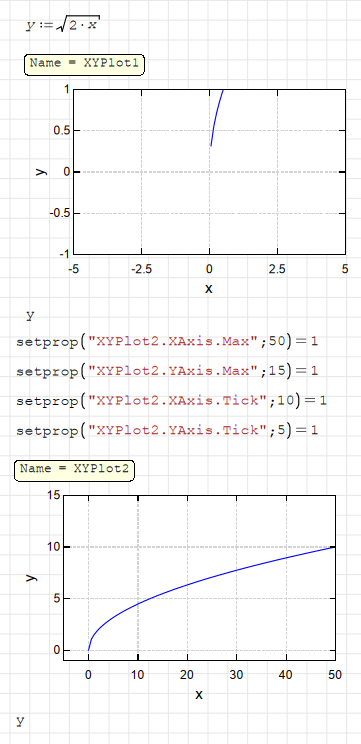
As a note: the 'name' of the graph (in this case XYPlot1 and XYPlot2) is specified via the XY-Plot Properties (i.e., double-click the graph to see the full list of properties); one of those fields is called "Name" which would be the title to reference the Plot through the 'setprop()' command.
May this be of Good Help;
⚜ Kenny Lemens, P.E. ᵂᴵ
"No matter where you go, there you are." -Buckaroo BanzaiHotkeys: https://en.smath.com/forum/resource.ashx?a=45771&b=2