1 страниц (15 вхождений)
Create a graph with x-y plot - Сообщения
Hey guys,
im trying to plot my function with x-yplot (addon) but it doesnt work. I will be happy if can someone can help me.
i define two functions (with If-clauses) and now I have to put it in x-y-plot.
Thanks for helping
Pfahlsetzungslinie.sm (101,89 КиБ) скачан 1144 раз(а).
im trying to plot my function with x-yplot (addon) but it doesnt work. I will be happy if can someone can help me.
i define two functions (with If-clauses) and now I have to put it in x-y-plot.
Thanks for helping
Pfahlsetzungslinie.sm (101,89 КиБ) скачан 1144 раз(а).
WroteI define two functions (with If-clauses) and now I have to put it in x-y-plot.
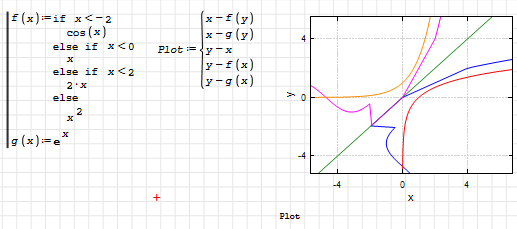
1. Start by the first red instance ... assign the demand.
2. For the plot Units don't match
3. Check if your incomplete Bolean is OK ... here shown complete.
4. What is mPa
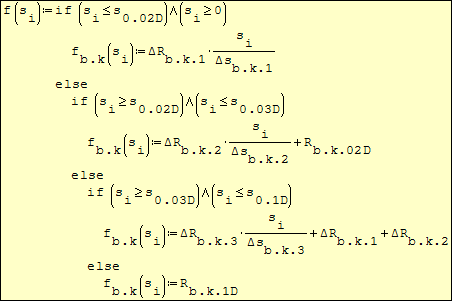
If you want to plot, you have to eliminate units.
Either by writing a unitless function, or using units while plotting.
I would rather second one.
Regards
Pfahlsetzungslinie.sm (112,67 КиБ) скачан 1184 раз(а).

Either by writing a unitless function, or using units while plotting.
I would rather second one.
Regards
Pfahlsetzungslinie.sm (112,67 КиБ) скачан 1184 раз(а).
hey guys thanks. (i tryed to give you a thanks but i always get an error)
it works now. Ive realized my mistakes.
i have 2 more question.
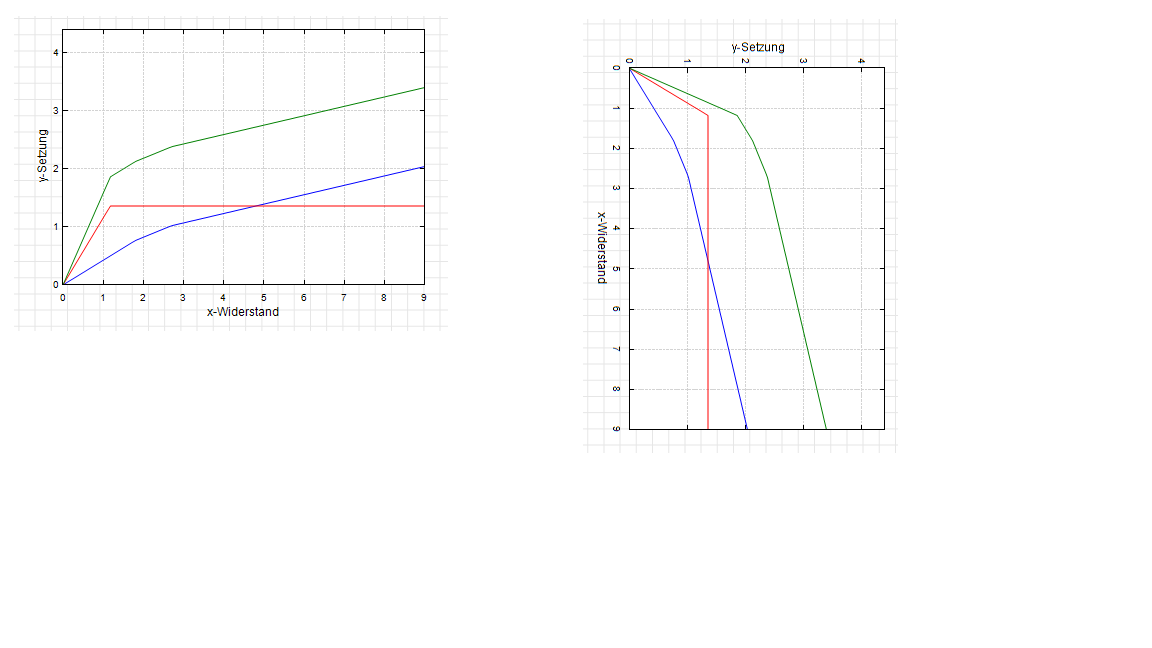
1. is it possible to rotate the graph or function? I wanna switch x and y axis
2. i wanna make the visible spectrum of x and y axis depent on a variable. like X-Axis Max=s1 and Min=s2
//sorry for my bad english
it works now. Ive realized my mistakes.
i have 2 more question.
1. is it possible to rotate the graph or function? I wanna switch x and y axis
2. i wanna make the visible spectrum of x and y axis depent on a variable. like X-Axis Max=s1 and Min=s2
//sorry for my bad english
Wrotei have 2 more question.
1. is it possible to rotate the graph or function? I wanna switch x and y axis
2. I wanna make the visible spectrum of x and y axis depend on a variable. like X-Axis Max=s1 and Min=s2
I understand 1 ... 2 Not clear.
Cheers ... Jean.

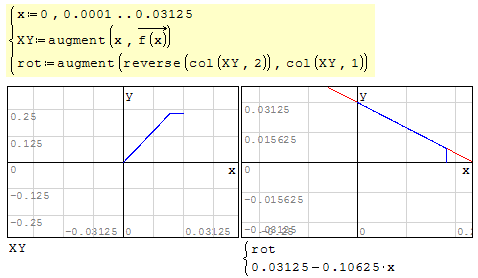
... once the discrete data set in hand,
you can rotate by any angle as desired.
you can rotate by any angle as desired.
Wrote2. I wanna make the visible spectrum of x and y axis depend on a variable. like X-Axis Max=s1 and Min=s2
If I understand: once the discrete data set in hand,
very easy to range between Mi/Max.
Produce the discrete data set, I will terminate.
Cheers ... Jean.
Wrote... i have 2 more question.
1. is it possible to rotate the graph or function? I wanna switch x and y axis
2. i wanna make the visible spectrum of x and y axis depent on a variable. like X-Axis Max=s1 and Min=s2
Hi Beyaz.
1. Yes. For example you can use this technique over your functions
xy-yx-plot.sm (7,16 КиБ) скачан 1115 раз(а).
2. Yes. For example you can try to learn about how to use setprop in an XY plot region.
Best regards.
Alvaro.
question 2: solved after find this
https://en.smath.com/forum/yaf_postsm57205_X-Y-Plot-Region.aspx
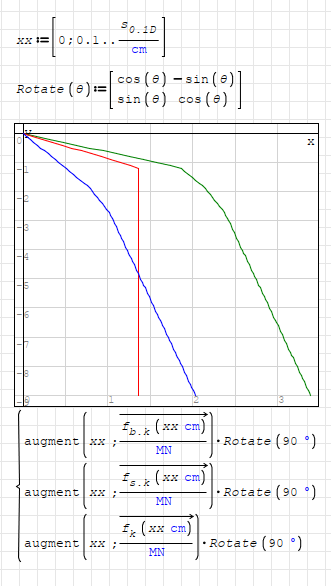
but to rotate the graph like this it didnt work. i tried your suggestions. Pfahlsetzungslinie1.sm (80,01 КиБ) скачан 1138 раз(а).
https://en.smath.com/forum/yaf_postsm57205_X-Y-Plot-Region.aspx
but to rotate the graph like this it didnt work. i tried your suggestions. Pfahlsetzungslinie1.sm (80,01 КиБ) скачан 1138 раз(а).
Hi. You need to specify the XYPlot index. This is how to swap axis coordinates, and reverse the y-axis. I reduce the number of points in the XYPlot to 50.
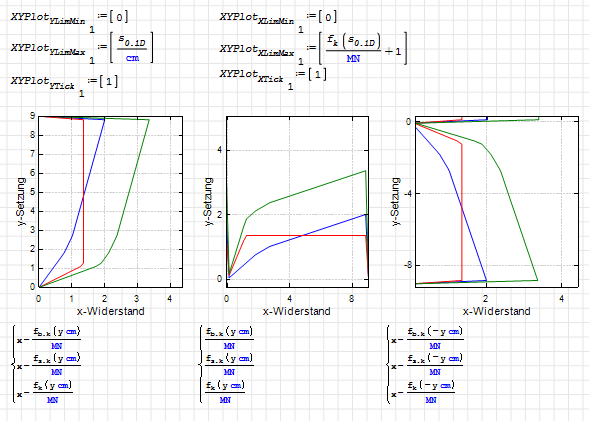
Pfahlsetzungslinie1.sm (87,42 КиБ) скачан 1162 раз(а).
Best regards.
Alvaro.
Pfahlsetzungslinie1.sm (87,42 КиБ) скачан 1162 раз(а).
Best regards.
Alvaro.
WroteBut to rotate the graph like this it didn't work.
I tried your suggestions.
You haven't produced the discrete data set.
Cheers ... Jean.
Wanna Rotate.sm (14,34 КиБ) скачан 1091 раз(а).
You can also use a rotation matrix.
It works on both 2DPlot an XYplot.
Regards
It works on both 2DPlot an XYplot.
Regards
1 пользователям понравился этот пост
churichuro 13.02.2023 16:11:00
Rotate XY.sm (486,01 КиБ) скачан 1132 раз(а).
1 страниц (15 вхождений)
- Новые сообщения
- Нет новых сообщений